
 Yahoo Finance
 USDCHF Chooses to Follow the Trend
On the USDCHF recently we had a typical battle between the trend followers and the counter trend traders. Personally I am a trend follower so the fact that this camp won and I write about that should not be a surprise. Going against the Dollar in the current conditions is nothing amazing but going against the dollar and buy the save heaven asset (CHF), when everybody is in the full Risk-On mode is not very popular. But that what the technical analysis is suggesting us so if you believe in that, there should be no place for hesitation.
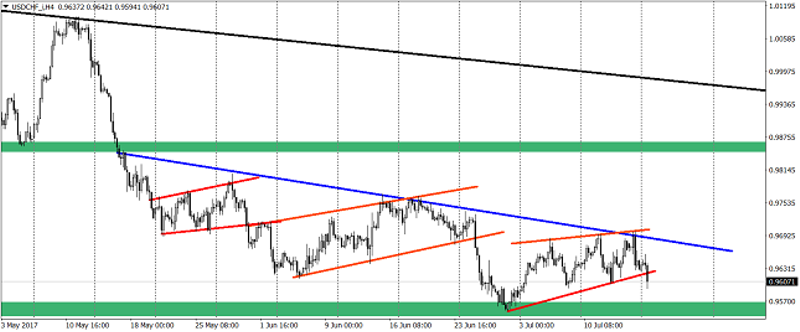
What the technical analysis is telling us right now? Well, we are having a beautiful mid-term downtrend, which since the middle of the May was paused three times by very technical trend continuation patterns (flags and a wedge), which resulted in the further downswing. Currently we can see that the price is breaking the lower line of the third formation, which automatically triggers a sell signal here with the first potential target on the latest lows – 0.955 (green area).
Why I said at the very beginning that counter trend traders (in this case buyers) had their chance? For some time they could expect a double bottom formation here. We had a MACD (and other major indicators) divergence here and the second bottom was established on a very important long-term support (green area). That was positive but what they were still missing was the breakout of the blue line connecting recent lower highs (and we were warning about that in our trading sniper videos). They had their chance on Friday but worse data from the US crashed those dreams.
To sum up, current market conditions are suggesting us that in the mid-term the downswing is more probable and we should see the price on the 0.955 very soon.
This article is written by Tomasz Wisniewski, a senior analyst at Alpari Research & Analysis
This article was originally posted on FX Empire
More From FXEMPIRE:
E-mini Dow Jones Industrial Average (YM) Futures Analysis – July 17, 2017 Forecast
S&P 500; US Indexes Fundamental Daily Forecast – U.S. Investors Optimistic About Earnings
S&P 500; US Indexes Fundamental Weekly Forecast – Investors Anticipating Strong Earnings Season
Major US Indices Forecast, July 17, 2017, Technical Analysis
Major US Indices, Forecast for The Week of July 17, 2017, Technical Analysis
Dow Jones 30 and NASDAQ 100 Price Forecast for the Week of July 17, 2017, Technical Analysis
