
 Yahoo Finance
 USDCHF Analysis: Swiss Franc Weakens Ahead of FOMC
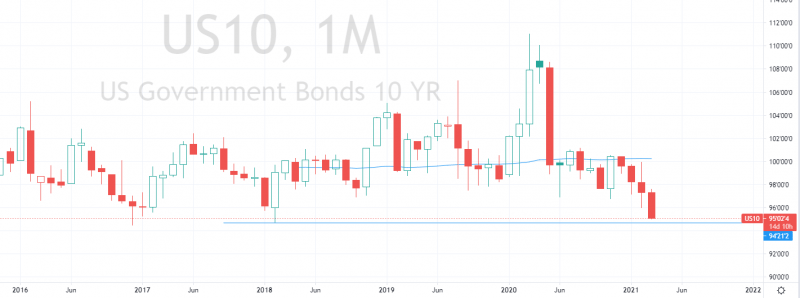
The US building permits dropped significantly in February, 1,682M building permits issued in February which is 204M lower than in January. The US 10Y bond yield nears the 2018 lows, and notwithstanding to that fact the US Dollar Index continues to gain nearing 92 today.
The year has started unfortunate for the Swiss Franc as the CHF lost 6.33% to GBP, 2.15 to Euro and 5% to Australian Dollar.
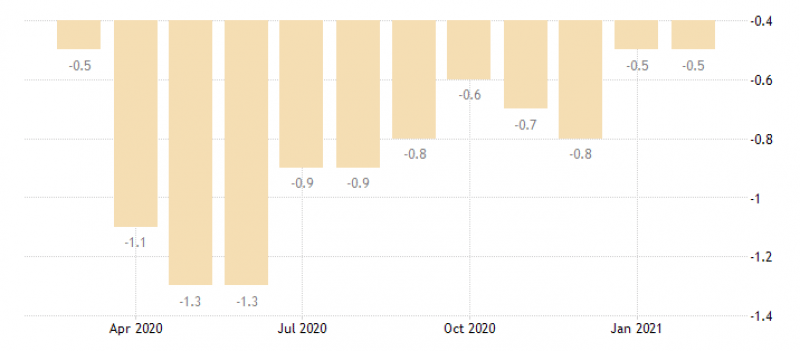
The negative rates kept by the SNB, causing the inflation to remain negative, for the second month in a row the inflation in Switzerland remains -0.5%. Though the deflation has significantly improved, according to the data the state is still in deflation mode for a consecutive year. Incomes of the Swiss National Bank have dropped significantly in 2020, resulting in a total loss of 27,982.1M CHF.
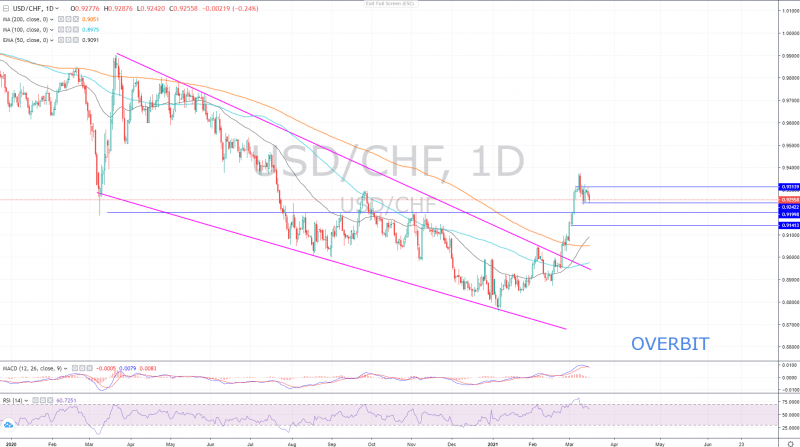
USD/CHF is in a correction mode in a whole week since March 10, after a trend reversal early this year. The breakout from the descending ending diagonal supported the uptrend of the US Dollar against the Swiss Franc.
4-Hour chart of the pair suggests that the uptrend continuation of the pair is possible after a confirmed breakout from the triangle.
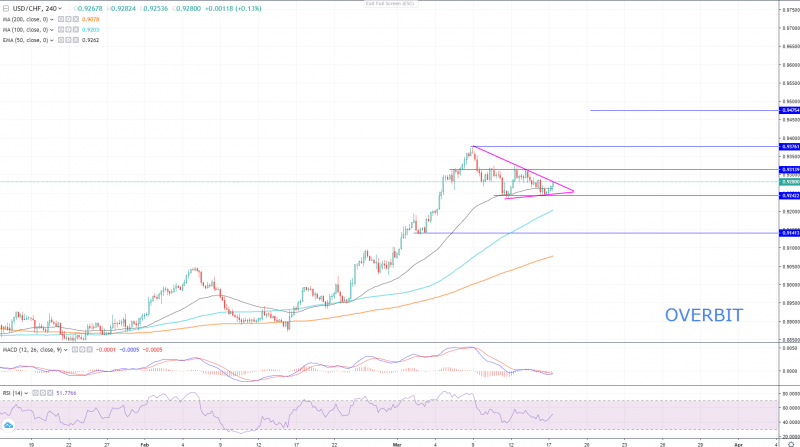
By the time of writing this article, USD/CHF on Overbit is traded at $0.92800 and is testing the upper edge of a triangle pattern. The breakout from this triangle will trigger a jump towards $0.93760 and $0.94750 above the local high. The uptrend is supported by RSI and MACD indicators as well as the EMA50. The volatility during the FOMC meetings will create a bumpy road for the price’s ongoing trend-continuation, hence it is highly recommended to keep eye on key levels, supports and resistances, one important resistance lies at $0.93140.
This article was originally posted on FX Empire
