
 Yahoo Finance
 USD/CAD Daily Forecast – Traders Eye the Critical Canadian Q2 GDP
Notably, the USD/CAD pair was trading within the 1.3273/1.3319 range level for the last two days in a row. Even today, the pair was consolidating in the same manner after marking day’s opening near 1.3283 level.
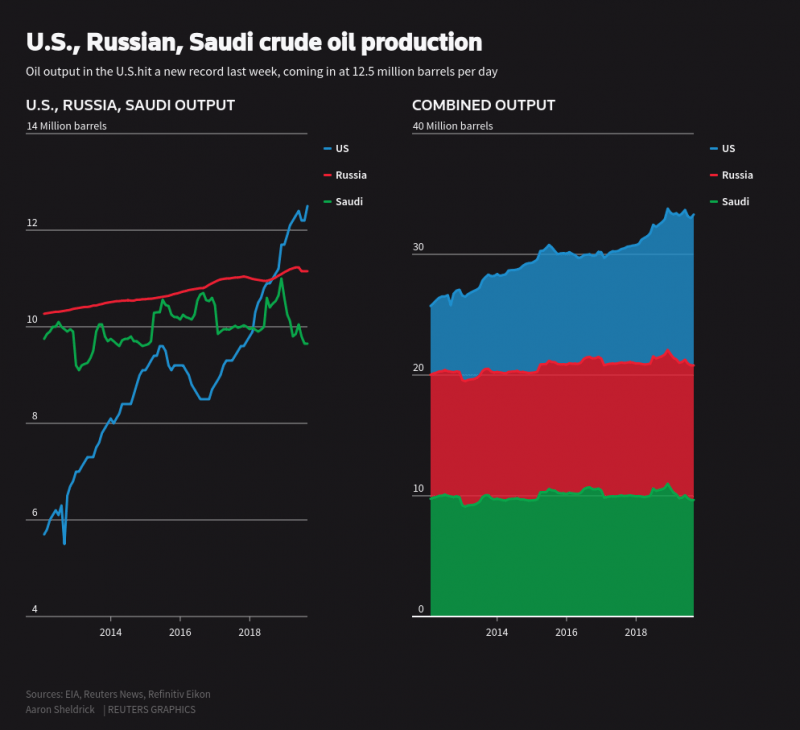
Finally, the Crude prices slipped on Friday after three consecutive positive sessions. Anyhow, the hurricane in Florida, a drop in the US stocks, and lowered trade tensions kept the Oil prices uplifted.
“It is very difficult to predict the sudden twist and turns in the Sino-US trade backdrop,” said Samuel Siew, investment analyst at Phillip Futures in Singapore.
Significant Economic Events
Last day, the market had witnessed the US Q2 QoQ GDP data release that came lower than the previous figures. Today, the market participants await the Canadian Q2 QoQ Annualized GDP data. The Street analysts expect this crucial GDP figure to record a whopping 3.0% over the previous 0.4%. Hence, if the actual reports happen to remain in-line with the market forecasts, then that would slice off pair gains. Meantime, few low volatile CAD-specific data releases like the Industrial Product Price and Raw Material Price Index might try to catch traders’ attention.
On the USD side, August Chicago Purchasing Managers’ Index and Michigan Consumer Sentiment Index might attempt to tweak the pair’s daily price actions.
Interim, Baker Hughes US Oil Rig Count would come out at around 17:00 GMT. This Crude data report release might have a direct impact on the Oil prices and an inverse effect on the Loonie pair.
Technical Analysis
1-Day Chart
On the daily chart, the Loonie pair appeared to linger inside the upper vicinity of the Bollinger Bands, sustaining a strong uptrend.
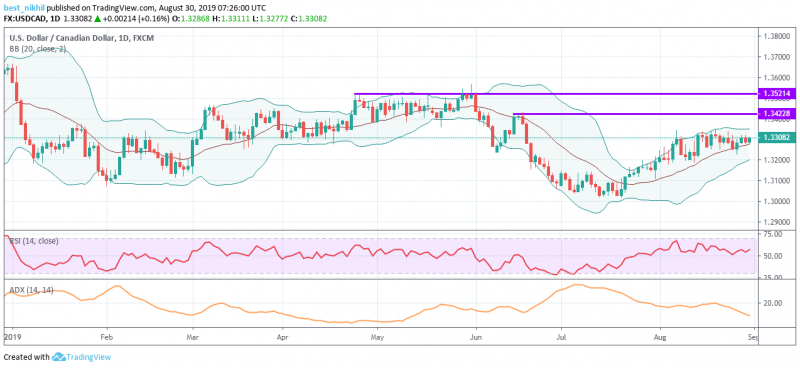
Anyhow, if the pair slips below the center line of the Bollinger Bands, then that would trigger a trend reversal. Quite notably, the USD/CAD pair continued to showcase a choppy performance since mid-August. The Relative Strength Index was just above the 50 mark, signaling a weak market interest. Also, the Average Directional Index (ADX) was indicating 13.73 level, which stands lower than the 20 range-bound benchmark. Therefore, such weak ADX value forecasts higher chances of range-bound performance to remain in the upcoming sessions.
3-Hour Chart
On the 180-Min chart, the Bollinger Bands seemed to shrink, signaling the dampening of volatility in the price actions. Though the pair stays in the upper region of the Bands, the bulls appear to lack the desired momentum to make a strong move.

Meanwhile, the MACD lines were taking a straight-line path, showing inadequate strength in the bulls. Nevertheless, the Stochastic Oscillator was pointing to the north, aiming to reach the overbought conditions. On the upper side, robust resistances remained stalled near 1.3315 and 1.3339 levels.
Click Here to start trading.
The article was written by Anthony Darvall, Chief Market Analyst at easyMarkets (www.easymarkets.com)
This article was originally posted on FX Empire
More From FXEMPIRE:
Price of Gold Fundamental Daily Forecast – May Be Fairly Priced, Due for Correction into Value Zone
Bitcoin Cash – ABC, Litecoin and Ripple Daily Analysis – 30/08/19
Asian Shares Finish Mostly Higher; Profit-Taking Hits Shanghai Index
Oil Price Fundamental Daily Forecast – Resumption of US-China Trade Talks Underpinning Prices
