
 Yahoo Finance
 USD/CAD Daily Forecast – Oil Prices Slip Amid Intensified Trade Tensions
On the 15-min Chart, the Loonie pair appeared to burst off a squeezed Bollinger Bands, showcasing substantial volatility. Anyhow, the USD/CAD pair was taking a U-turn at around 10:15 GMT after touching 1.3338 highest mark. On the downside, the stable 1.3317 resistance handle might act as a potential support mark.
Crude Falls on Trade War Updates
During the weekend, the US announced and brought into action a 15% tariff imposition over a variety of Chinese goods. Notably, these Chinese goods include footwear, smartwatches, and flat-panel televisions. However, the trade tensions further worsened as China played an immediate tariff retaliation. Quite noticeably, China imposed fresh duties on the US Crude, lowering the demand for the commodity.
“Despite President Trump dismissing concerns about a protracted trade war, we are of the view that the latest escalation would not result in a trade deal anytime soon,” said Samuel Siew, investment analyst at Phillip Futures in Singapore.
Significant Economic Events
The US and Canadian markets would remain closed on Monday on account of Labor day. Hence, the traders might pay less attention towards the economic calendar events today amid a lack of crucial data releases. Even amidst the absence of oil-catalyst data releases, the Crude prices kept fluctuating on the back of trade concerns.
Technical Analysis
1-Day Chart
On the daily chart, the Loonie pair appeared to take a small climb after struggling inside the red Ichimoku Clouds for the last few sessions. Nevertheless, the 1.3345 resistance handle might act as a sturdy resistance level, disallowing a choppy breakout. Somehow, if the pair makes a triumphant move above the aforementioned handle, then that would open up challenges over the 1.3428 and 1.3521 levels.
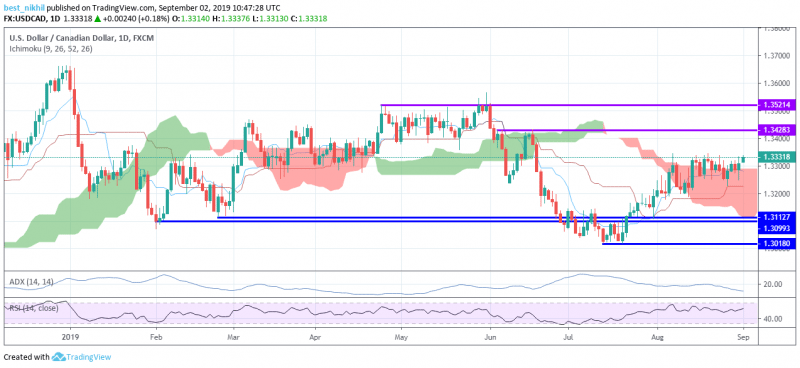
Notably, the ADX (Average Directional Index) technical indicator was still indicating below 20 mark, forecasting a consolidated performance. At any point, the buyers might catch some fresh bids, lifting the RSI revealing a decent buying interest of 69 levels. On the lower side, support handles remain stalled near 1.3113, 1.3099, and 1.3018 levels.
4-Hour Chart
The USD/CAD was hovering near the upper corner of the Bollinger Bands, strengthening the bulls. However, the Stochastic Oscillator was displaying overbought conditions, crossing above the 80 benchmark. Notably, the pair was testing the sturdy 1.3383 resistance level since the last month.

Also, the bulls stood highly confident, considering the underlying significant 200-day Simple Moving Average (SMA). Hence, on connecting all the dots, chances of the pair to jump above the 1.3383 resistance remain high. In the meantime, a more than a month old slanting support line stay well intact to prevent any potential downside movements.
This article was originally posted on FX Empire
