
 Yahoo Finance
 USD/CAD Daily Forecast – Loonie Spurts Down Ahead of CAD Retail Sales & FOMC Minutes
The Loonie started trading on Wednesday morning near 1.3404 levels. The pair showed a slight upward movement in the early developing hopes among the traders. However, later on, the USD/CAD pair gave away the morning gains dropping near 1.3391 levels.
Canadian Currency stood high following the US removal of Aluminium & Steel tariffs. There stays a negative correlation between the CAD and Loonie. Hence, the USD/CAD pair was looking south. Along with this rationale, the falling Greenback amid US-Sino trade tensions also contributed to the Loonie plunge.
Meanwhile, the Crude Prices continued to drop two days in a row. The last day’s plunge came after the API revealed huge crude stockpile reports. Higher Crude Inventory count depicts lower demand for the black gold in the market, lowering its price.
Today, the Oil prices declined as Organization of Petroleum Exporting Countries and its allies quoted contrasting comments. Saudi Energy Minister proclaimed that the country would continue with supply cuts as to balance the OPEC+ decided production levels. On the contrary, Russia looks to keep up the current oil supply rate. The member hinted that they would appeal for a modification in the OPEC+ Production deal in the next meet.
The black gold had marked the day’s low near $62.35 per barrel at around 08:45 GMT.
Disputes between the US and Iran over the sanctions also continued to sustain pressure over the commodity, thereby on Loonie.
USD/CAD Influencing Events
Two Significant CAD-specific reports will come out in the European trading session. These are the March MoM Retails Sales and the Retail Sales excluding Autos data. The consensus estimates the former data to increase with 0.2% and the latter data, to enhance reaching near 0.9%. Overall, the market sets a positive stance over the CAD events. So, if the expectation comes out true, then the Loonie may continue the plunge rally.
At 14:00 GMT, the Fed’s John C. Williams, and Raphael W. Bostic will give their opinions about the Monetary Policy. The FOMC Minutes will occur at 18:00 GMT, in which the members of the FOMC will discuss Rate Policy. Last time the Federal Reserve talked about temporarily holding the interest rates. Despite that, the Fed surprisingly did Rate cuts in Interest on Excess Reserves (IOER). Hence market awaits for the reasoning behind this move, and this may also significantly impact the pair.
Technical Analysis
1-Hour Chart
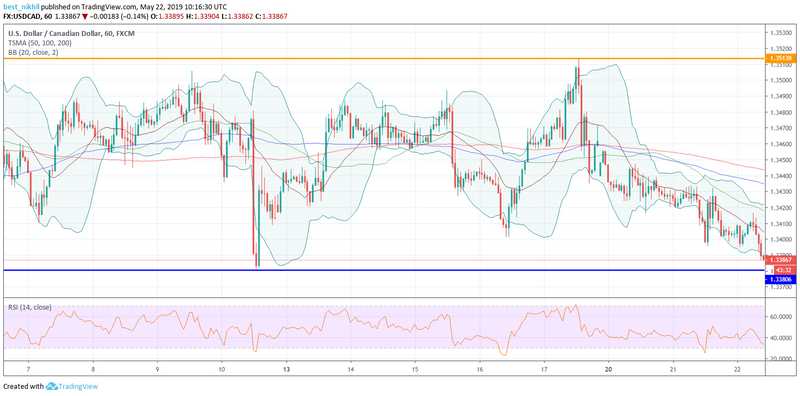
The Loonie appeared in the lower vicinity of the Bollinger Bands (BB). This position of the pair signaled for a bear call. The upper band and the lower band of the BB records around 1.3421 to 1.3388 levels. At 09:00 GMT, the Loonie crossed the lower boundaries of the BB near 1.3389 levels, and it may drift down laterwards. A support line near 1.3379 levels awaits if the pair slumps down further.
4-Hours Chart
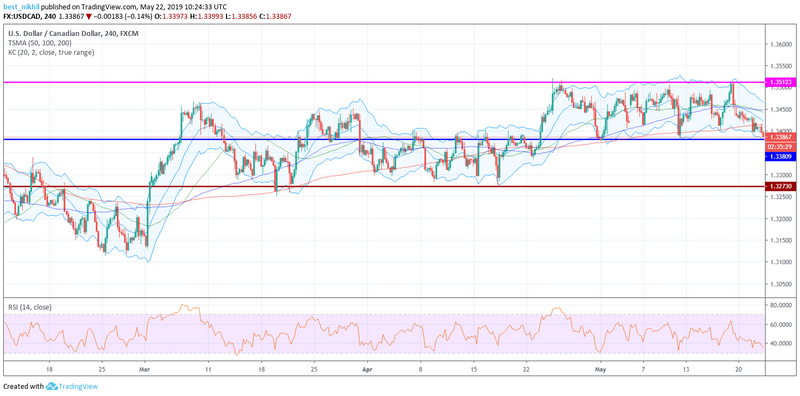
All the significant Simple Moving Averages (SMA) stood above the pair, alludes bearish outlook. Strikingly, the 50-days SMA remained below the 100-days, and the 200-days SMA and near-term status look bullish. A resistance point near 1.3512 levels and a support line close to 1.3379 levels await. The Relative Strength Index hovered near 35 levels, alluding moderate selling.
This article was originally posted on FX Empire
