USD/CAD Daily Forecast – Gann Chart Indicated a Bull Trend in the Long Run
After opening on Thursday morning near 1.3423 levels, the USD/CAD pair demonstrated a small bump touching 1.3430 levels. There was a decreasing slope observed in the pair’s movements laterwards. On moving further down, the pair would test the critical support line near 1.3407 levels.
Rising Concerns Over US-Mexico Trade Tensions
Trump administration officials had conducted a meeting for negotiations with the Mexican counterpart last day. Reports suggested a “not nearly enough” progress out of the Wednesday talks. The Officials would gather again on Thursday to continue the second day of negotiations. Meanwhile, Trump reiterated that the Mexican 5% tariff duties would take effect from June 10. The President also added that the tariffs would rise 5% every month as per schedule reaching 25% in October. The rising trade tensions could act as a vital player in reducing the overall global demand for energy leading to an economic slowdown.
Oil prices do have an inverse impact on the Loonie pair. Last day, the Crude WTI Futures was hovering near its 5-month bottom levels.

However, the prices appeared to stabilize in the morning session and was trading near $51.85 bbl. The primary catalysts for the downturn in the commodity prices are the escalating trade tensions.
Events that Need a Closer Watch
Canadian Trade data will come out at around 12:30 GMT. Though negative numbers, the Street Analysts have set a bullish stance on the April International Merchandise Trade figures. Ivey May PMI data is something interesting in the Canadian economic calendar today. The PMI data might come quite bearish this time.
On the US side, Unemployment data, Non-Farm Q1 Productivity, and Unit Labor Costs have lined-up to violate the pair’s movements.
Technical Analysis
1-Hour Chart

In the near-term, the primary trend seems to be an uptrend as the 50-days SMA cross path with pair moving below the trade. However, the Significant 200-days SMA lined-up above the pair calls for a strong negative trend in the long run. The Parabolic SAR which was moving above the pair confirms the bearish legs. Anyhow, the pair might throw an attempt to make a breakthrough from the overhead 1.3433 resistance levels.
1-Day Chart

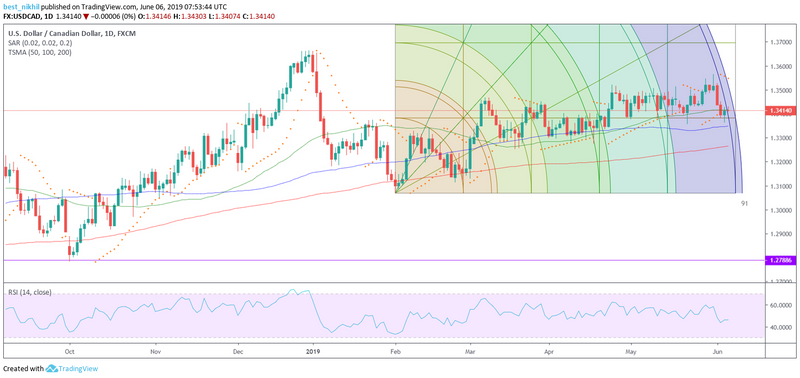
According to the Gann Square Indicator, the pair was trading above the 1.3384 levels showing sustainability in the uptrend. The pair had recently found support near the Gann Square to move upwards. Hence, the downside remains limited in that case. However, a small trend change might happen as the pair heads Fibonacci Arc. Next target lines for the USD/CAD pair stand near 1.3700 levels. The pair traveled well above the significant 200-days SMA showcasing bullish prospects for the future movements. Nevertheless, the investor interest remains currently low as the Relative Strength Index (RSI) indicated 47.16 levels low levels.
This article was originally posted on FX Empire
More From FXEMPIRE:
USD/JPY Fundamental Daily Forecast – Risk-on, Risk-off Indecision Fuels Sideways Trade
AUD/USD and NZD/USD Fundamental Daily Forecast – Traders Keying on Interest Rate Differential
USD/CAD Daily Forecast – Gann Chart Indicated a Bull Trend in the Long Run
The Markets Have Made Up their Mind about Where the Global Economy is Going

 Yahoo Finance