
 Yahoo Finance
 USD/CAD Daily Forecast – Descending Slanted Resistance Restricting Near-term Rises
On Monday morning, the USD/CAD pair was underway extension of previous day downtrend. On moving downside in the Asian session, there was some noticeable support near 1.3026 level. Notably, this support line had remained as a firm cushion since last few sessions limiting daily losses.
In the meantime, the Crude prices appeared to lose hold off its six-week high mark. The Crude WTI Futures was trading near $59.96 bbl at around 06:07 GMT. The commodity prices dropped after China posted its slowest quarterly economic growth in at least 27 years. China is the biggest buyer of Crude Oil. Hence, any downturn in its economy would have a direct impact on the demand cycle of the commodity.
On Sunday, Iranian President Hassan Rouhani broadcasted in a television speech that Iran is ready for settlements with the US if Washington removes sanctions and comes back to 2015 Nuclear deal.
In the early hours, the US Dollar Index appeared to consolidate near 96.84 level. The primary support line near 96.80 mark was restricting the downside while 96.90 preventing the upside.
Significant Economic Events
There are neither CAD-specific events nor Oil-catalyst events on Monday. However, some low volatile USD-specific events might give a try to tweak the pair’s daily movements. The first in the economic docket is the July NY Empire State Manufacturing Index. This time, the market expects a positive 0.5 points over the previous negative 8.6 points. At around 15:30 GMT, the 3-month and 6-month Treasury bill yields are also something worth noting.
Technical Analysis
1-Day Chart
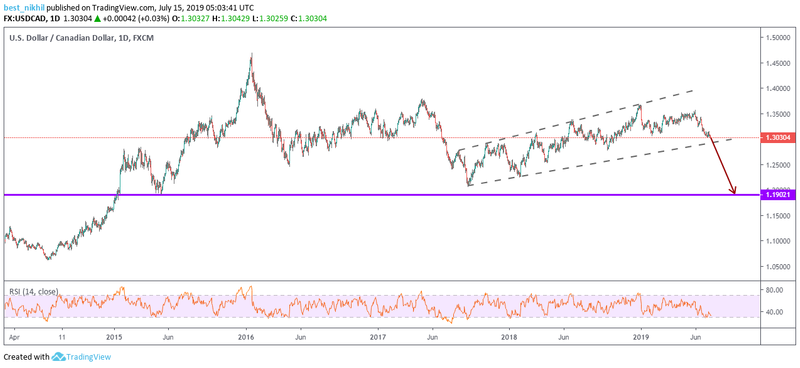
The USD/CAD pair was forming a bearish rising wedge trading pattern. The latest move was addressing the reluctance of the pair to stay within the wedge bracket. However, if the pair continues to drown further, rising wedge might play its role, allowing the bears to take the lead.
4-Hour Chart

Chances of a medium-term uptrend shrunk as the significant 50-day SMA hovered above the pair. A triumphant march above this aforementioned SMA would have enabled the pair to challenge another set of resistance conflux. This conflux consists of the strong 1.3146 resistance, 1.3234 support-turned-resistance, and 200-day SMA.
1-Hour Chart
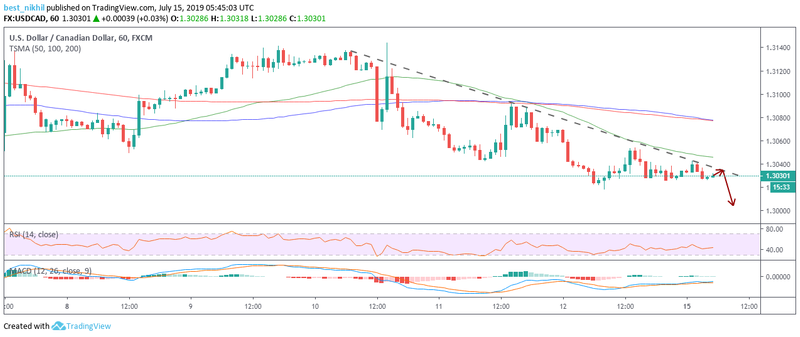
On an hourly chart, the USD/CAD pair appears to struggle since few sessions to move above the 5-day old descending slanted resistance. However, any favorable price would hit this aforementioned resistance line at 1.3035 psychological mark. From there, the pair might rebound, illustrating downtrend continuation. Also, the Moving Averages Convergence Divergence (MACD) showcased few minor green histograms, suggesting a small rise in the short-term.
This article was originally posted on FX Empire
More From FXEMPIRE:
AUD/USD and NZD/USD Fundamental Daily Forecast – RBA Will Cut Rates “If Needed”
E-mini Dow Jones Industrial Average (YM) Futures Technical Analysis – July 16, 2019 Forecast
Pavel Durov Holds Off With TON, Waiting For the Libra Hearings to End
USD/CAD Daily Forecast – Bulls Crossing Fingers, Expecting US Oil Output Growth
