
 Yahoo Finance
 USD/CAD Daily Forecast – Bulls Crossing Fingers, Expecting US Oil Output Growth
The Loonie pair opened up today near 1.3049 level and showcased a breakout, shattering the sturdy 1.3054 resistance. Somehow, the pair rebounded in the Asian session itself after touching the 1.3059 mark. On the downside, the bears ensured to cross and below the near term 50-day SMA. However, pair found significant stoppage near 1.3049 resistance-turned-support laterwards.
On the USD front, things appear more bullish in the short term. The Greenback bulls had already crossed above the 50-day SMA yesterday.
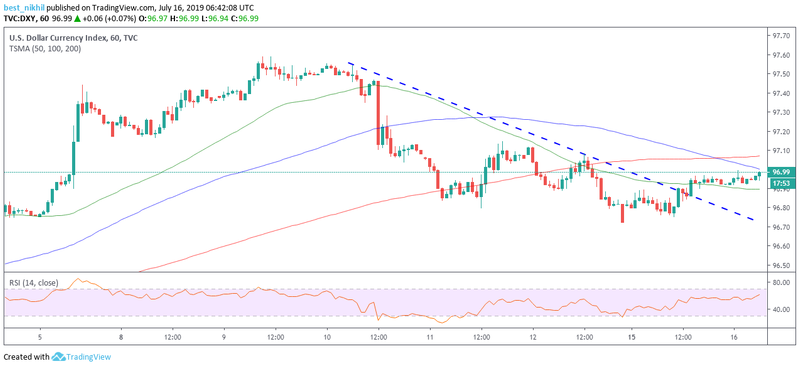
In the early hours, the US Dollar Index was heading north, targeting the 100-day and 200-day SMA confluence. Any move taking the Index above this confluence would enable it to challenge the robust 97.09 and 97.12 levels.
Meanwhile, the Oil prices were heading down, trading near $59.44 bbl. US Oil Production resumed in the Gulf of Mexico region after Hurricane Barry. The market expects the Crude output to rise undermined US production restart. Such an action would go against the OPEC+ supply cuts, who agreed on another extension for nine more months.
Significant Economic Events
Today, there are quite a few high volatile economic events on the US economic docket. Among them, the vital events remain the Fed‘s Chair Powell’s speech and June Retail Sales data. This time, the Street expects the Retail Sales Control Group data to report near 0.3% over 0.4% forecasts.
Traders must also pay some attention to the June MoM Retail Sales and Retail Sales excluding Autos. This time, market keep a bearish stance over both these reports, expecting a 0.2% over the previous 0.5%.
No Oil-catalyst reports are coming up on Tuesday. However, there are few low volatile CAD-specific events on Foreign and Canadian Securities.
Technical Analysis
1-Day Chart
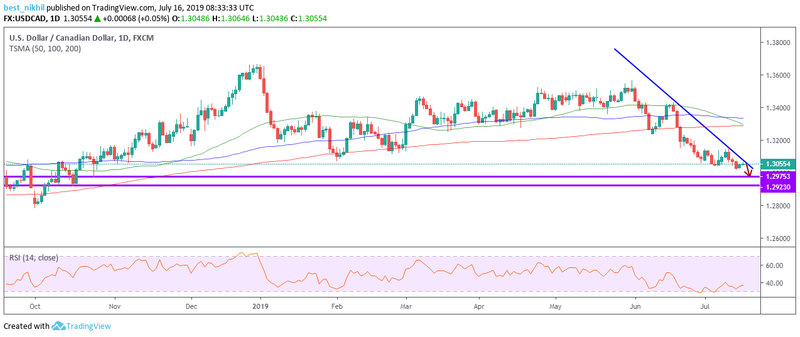
On the daily chart, the pair seemed to have difficulty in breaching the 1-month old descending slanting resistance. Even today, the pair continued to respect this strong resistance line. Hence, one can expect a rebound price action if the pair hits this resistance handle. On the downside, support lines stall near 1.2975 and 1.2923 levels. Even the Relative Strength Index (RSI) was indicating 38 levels, depicting lack of interest among the market participants.
3-Hour Chart

The Loonie pair was struggling with the 50-day and 100-day SMA confluence in order to justify the rising RSI indicator. A successful march above this resistance confluence would activate the overhead significant 200-day SMA. Before encountering this aforementioned major SMA, the pair also need to surpass the strong 1.3143 resistance. Meantime, a near-term downside remains limited as the pair appeared to clinch near its 9-month bottom.
This article was originally posted on FX Empire
