
 Yahoo Finance
 USD/CAD Daily Forecast – Bulls Aiming 1.3589 to Justify the Rising Wedge
The Loonie pair appeared to shed off some of its previous day accumulated gains after marking the day’s opening near 1.3314 levels. Anyhow, the early hour’s plunge rally found a stoppage near 1.3276 mark. Quite noticeably, the pair remained adhered to this mark for the rest of the early morning session.
In the meantime, the Crude prices soared today over expectations that the OPEC might initiate supply cuts soon to support the falling prices. The Crude Oil WTI Futures were trading near $52.83 bbl, 0.83% up since the last closing.
Significant Economic Events
Weekly Jobless Claim data releases stay at the top in the trader’s daily event watchlist. This time, the market expects the Initial Jobless Claims computed since August 2 to report in-line with the previous 215K. However, the Street analysts keep a slight bullish aspect on the Continuing Jobless Claims calculated since July 26, expecting a 9K rise this time.
Though low volatile, today, the market would witness some CAD-specific data publishes. Statistics Canada would come up with the June New Housing Price Index at around 12:30 GMT. Notably, the Housing data play a crucial role in deciding the volatility (directly/indirectly) of CAD currency. The consensus estimate this Housing Index to report 0.0% over the last -0.1%.
Today, there remain no Oil-catalyst events like EIA or API Crude data, to tweak the commodity’s daily price actions.
Technical Analysis
1-Week Chart
On the weekly chart, the USD/CAD bulls appeared to roll up sleeves and head north side.
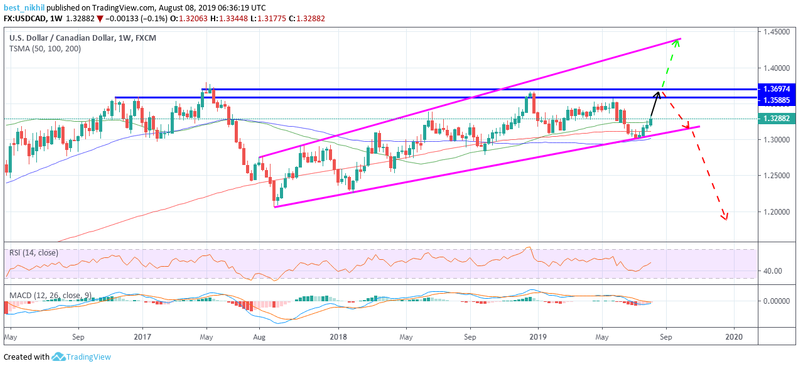
On marching more upside, the pair might encounter two sturdy resistances stemmed near 1.3589 and 1.3697 levels. From an overall perspective, the pair was forming a rising wedge bearish trading pattern. Anyhow, in the upcoming sessions, the pair would test the overhead aforementioned resistances in order to justify the rising wedge pattern. Notably, the Loonie pair stood firm above all the significant SMAs, strengthening the bulls. The 50-day SMA had recently crossed above the significant 200-day SMA, making a Golden Cross. Therefore, an imminent medium-term downfall would soon replace the near term bullish price actions. In the meantime, traders can take advantage of this short term with precautionary steps intact.
4-Hour Chart
The Loonie pair was moving in the upper vicinity of the slightly wider Bollinger Bands, sustaining a strong uptrend.
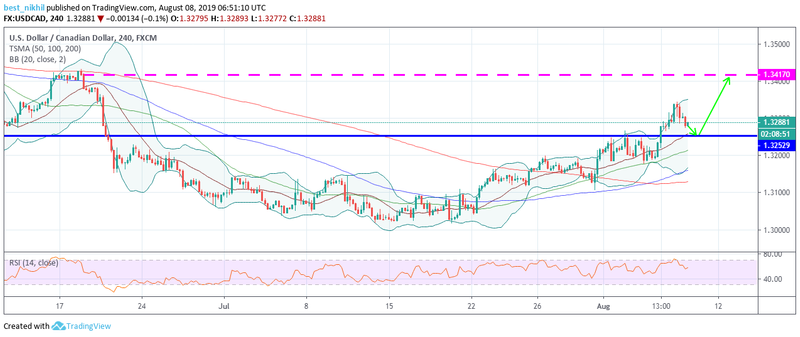
Nonetheless, the pair seemed to head downwards, aiming center line of the Bollinger Bands. Anyhow, before facing the center line, the pair might have to breach the healthy 1.3253 resistance level which might change its role, acting as a stable support line. Therefore, keeping in mind the takeaways out of the weekly chart, one can expect the pair to bounce off this aforementioned resistance that might turn into support handle. In such a case, the well above positioned 1.3417 resistance would get activated.
This article was originally posted on FX Empire
