
 Yahoo Finance
 USD/CAD Daily Forecast – 4H Chart Revealing Long-term Downtrend
On June 12, the Loonie pair had displayed a remarkable 0.56% upliftment reaching weekly highs. Last day, the pair lost almost 0.36% of those accumulated gains as Oil prices skyrocketed 2.2%. This commodity price surge had come after two tankers got attacked in the Gulf of Oman. However, the Crude prices slipped last night from $53.43 bbl reaching $51.77 bbl as demand appeared to fade. The decline in the demand outlook came as investors jittered over trade worries.
The USD/CAD pair marked the day’s opening near 1.3327 levels and went upwards breaching 1.3335 sound resistance. Anyhow, the pair got capped near 1.3345 level and was taking rounds near 1.3336/41 range laterwards.

The Oil prices had faced significant tortures over time amid rising trade tensions between the Superpowers. Yesterday, more than 600 US Companies wrote a letter to President Trump requesting to resolve the trade dispute with China. The Company list also included significant players like Giant Retailer Walmart and Target Corp. Walmart said that any increase in the tariffs would increase the prices for US consumers. “An escalated trade war is not in the country’s best interest, and both sides will lose,” the letter said.
The US President would meet President Xi in the upcoming G20 meeting scheduled on June 28-29. However, expectations over significant progress remain low out of the meeting.

Over to the Greenback side, things remain quite positive. Yesterday, the USD Index had soared 0.14% as investor hopes strengthened over rate cuts. This strengthening came after the release of weaker May Jobless Claim statistics. Meanwhile, the Greenback seemed to shrug over the May Import and Export Indices that missed estimates. Despite that, the US Dollar remained limited within 97.08 resistance cap today.
Significant Economic Events
On the events front, the docket remains lighter on lack of CAD-specific events. However, a few critical USD events line up in the early European session.
The Retail Sales Control Group will release the May figures at around 12:30 GMT. Street Analysts stay bullish over the numbers and expect a 0.4% growth this time. Somehow, the market sets a bearish stance on the Michigan June Consumer Sentiment Index, expecting a 2.04% decline.
Technical Analysis
1-Hour Chart
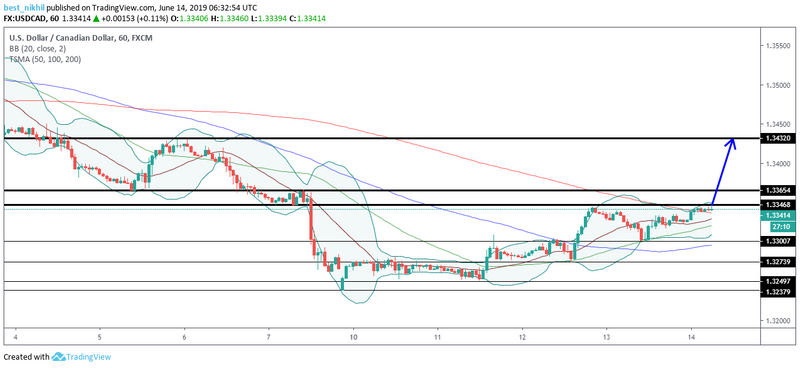
The USD/CAD pair continues to remain intact in the upper vicinity of the Bollinger Bands (BB) after crossing the EMA yesterday. The uptrend seems pretty evident from the BB technical indicator. The Loonie pair traveled above the significant 200-days, 100-days, and 50-days SMA confirming the bull call. Any movement above the 1.3347 and 1.3365 resistance levels would keep the uptrend sustained. On moving further upwards, the pair might experience some strong resistance near 1.3432 levels. While, on the flipside, healthy support points stand near 1.3300, 1.3274, 1.3250, and 1.3238 levels.
4-Hours Chart
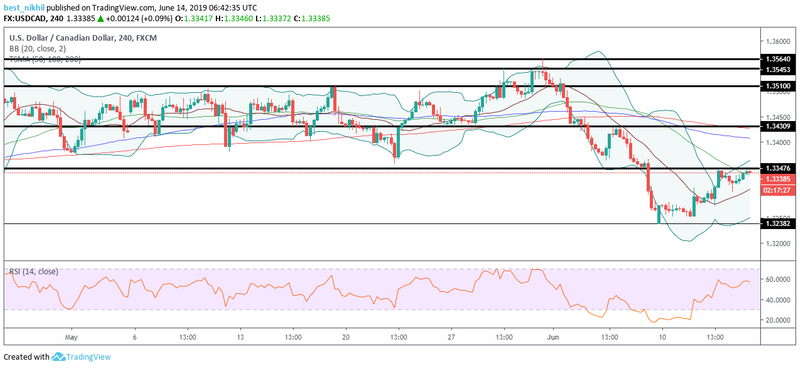
Though the picture is quite bright in the 1-Hour Chart or Near term outlook, the long term sentiment remains bearish. The 200-days and 100-days SMA hovered above the pair generating downtrend vibes. Anyhow, the pair remained stuck in the upper part of the BB with 50-days SMA below it.
In a nutshell, the near-term outlook is bullish while the long-term forecast remains bearish.
This article was originally posted on FX Empire
