USD/CAD Daily Forecast – 2.5 Month Old Symmetrical Triangle in Play
Bears handed control over to the bulls in the last North American session after bouncing off 1.3251 level. Anyhow, the pair took a rebound price action earlier today after touching the 1.3315 highest mark. During the Asian trading session, the Loonie pair was heading south side, shedding the accumulated gains.
Meantime, the Crude prices dropped in the morning neutralizing last night gains developed out of upbeat EIA reports. Market analysts expect a surge in the buildup of US Crude inventories in the coming sessions, weighed over rising trade tensions.
“We’ve got the concerns surrounding U.S. and Iran, but there’s not anything to push oil out of the current range. It just seems to be volatile within it,” said Jonathan Barratt, the chief investment officer at Probis Securities in Sydney.
Significant Economic Events
US Weekly Jobless Claim data and Markit PMI data release remain at the center stage for Thursday. This time, the market expects mixed Unemployment data. The Street analysts estimate the Continuing Jobless Claims computed since August 9 to record 1.700 million over 1.726 million. On the contrary, the consensus estimate the Initial Jobless Claims calculated since August 16 to grow 6K higher than the previous 210K.
Meantime, the market hopes the August Markit PMI Composite to come out 1.74% below the prior 51.7 points.
On the Canadian side, the June MoM Wholesale Sales data will come out at around 12:30 GMT. The Street expects this Sales data to publish +0.3% this time in comparison to the last -1.8%.
Notably, the economic calendar lacked EIA/API Crude data report releases, allowing the Crude prices to take a back seat today.
Technical Analysis
1-Day Chart
Since the start of June, the USD/CAD was forming a big symmetrical triangle. Till date, the pair had remained within the aforementioned triangle and has almost reached the apex point.

However, in the near-term, if the pair breaches the triangle, taking the upward path, then the pair might revisit 1.3423 and 1.3519 levels. Quite noticeably, the pair stays in the upper region of the Keltner Channel, sustaining and confirming an upcoming uptrend. However, any price action to the downside would immediately activate the stable 1.3113 support handle.
2-Hour Chart
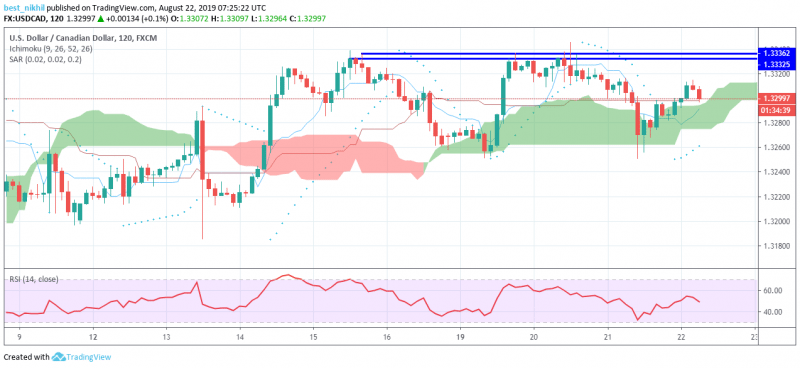
On the shorter timeframe, the USD/CAD appeared to head south.

Nevertheless, strong support region formed by the Green Ichimoku Clouds remains on the downside to catching the falling pair. However, the Parabolic SAR stood below the trading pair, generating some bullish perspective in the near term. Any movement to the upper side would call out the challenge over the resistances stalled near 1.3333 and 1.3336 levels. Nonetheless, chances for a favorable price action remained low, considering the RSI pointing towards 48 mark, developing neutral buyer interest.
This article was originally posted on FX Empire

 Yahoo Finance