
 Yahoo Finance
 USD/CAD Daily Forecast – 1.3344 Fibo Level Acting as a Critical Resistance
After marking the day’s opening near 1.3268 level on Monday, 1.3277 resistance ensured to cap daily gains in the Asian session. Traders can expect low volatility throughout the day amid lack of significant economic events.
USD Index at its Top Mark
Greenback bulls might conquer the pinnacle in the long-term soon, ignoring a near-term short impulsive downside. Substantial SMAs remain stalled near the bottom region of the USD Index chart, developing an excellent shield to limit daily losses.
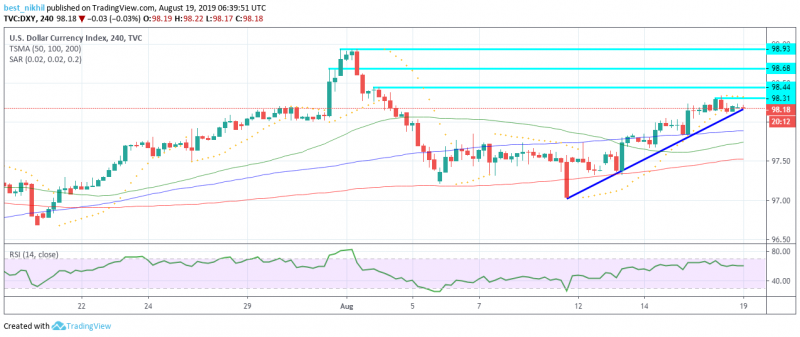
On the upper side, the Greenback might have to surpass multiple barriers to reach the 99 highest level. Overhead resistances stay stemmed near 98.31, 98.44, 98.68, and 98.93 levels. However, a stable 10-day old slanting support line was another point of interest on the south side.
Oil Prices Jumped on Rising Middle East Tensions
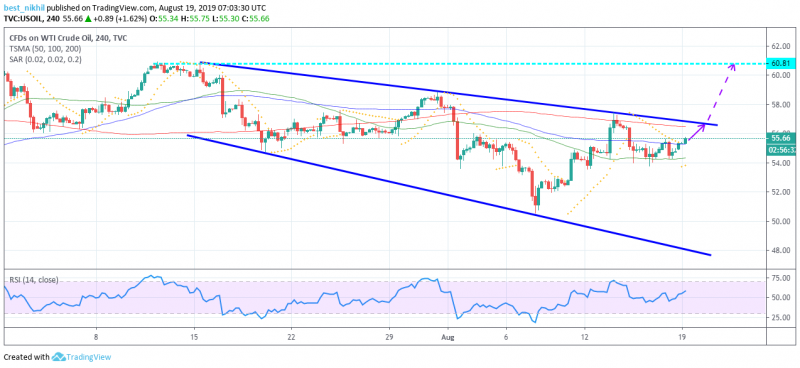
After a weekend attack on an oilfield in eastern Saudi Arabia, the Crude Oil WTI Futures grabbed some fresh bids, climbing new levels. Also, on the technical chart, the prices were forming a falling wedge trading bullish pattern. Hence, traders can expect a strong surge in the near-term prices soon.
Anyhow, escalating trade tensions continued to put a lid over any potential gains. Meantime, reports suggested that the US President Donald Trump was quite less optimistic over resolving the trade issues. Trump proclaimed, “I’m not ready to make a deal yet.”
Significant Economic Events
Today, traders can take a back seat as the economic calendar lacks critical USD-specific and CAD-specific events. Also, the market won’t witness any oil-impacting Crude reports like the EIA/API data reports on Monday.
Technical Analysis
1-Week Chart
On the weekly chart, the USD/CAD pair was heading upwards, targeting the center line of the Bollinger Bands.
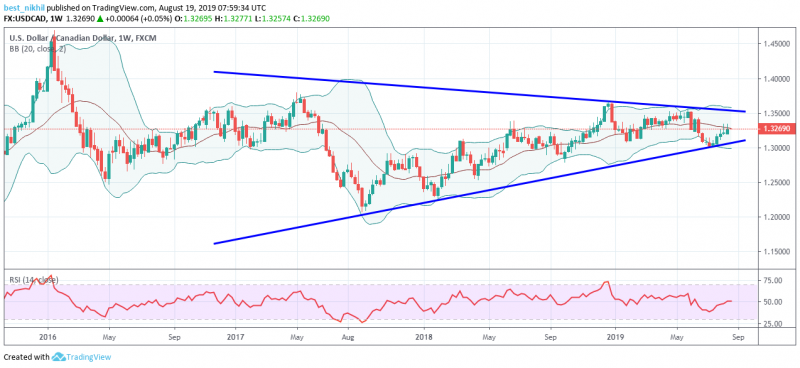
Anyhow, a triumphant march above the center line would signal for a sustained uptrend in the upcoming sessions. On an overall view, the pair was forming a symmetrical triangle for the last two years. Nevertheless, the Relative Strength Index (RSI) was stuck near 50 mark, revealing neutral buyer’s interest.
1-Day Chart
After testing the 1.3344 Fibonacci Retracement level last week, the Loonie pair appeared to rebound and head southwards.
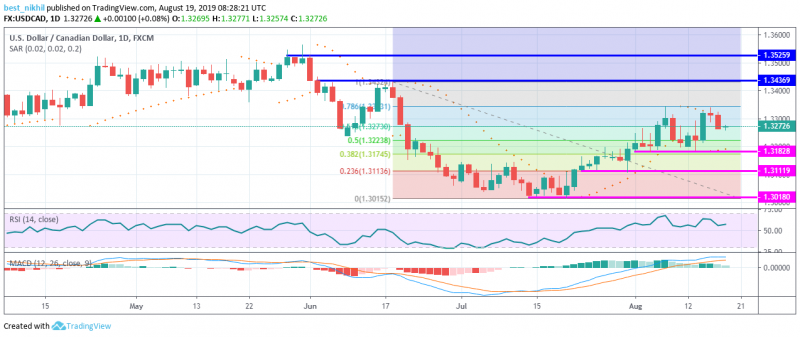
However, the MACD line and the signal line of the MACD technical indicator stood above the zero line, strengthening the bulls. Also, the below-lying Parabolic SAR provided additional support to the buyer side. Ability to breach above the 1.3344 resistance would enable fresh challenge over next resistances stalled near 1.3437 and 1.3526 levels. Any move on the flip side would activate the support handles near 1.3183, 1.3112, and 1.3018 levels.
This article was originally posted on FX Empire
