
 Yahoo Finance
 USD/CAD Daily Forecast – 1-Day Chart Forming a Falling Wedge Bullish Pattern
After marking the day’s opening near 1.3056 level, the Loonie pair had showcased a slight upliftment. However, the overhead moving 100-day SMA ensured to limit this immediate price action in the USD/CAD. From there, the pair appeared to take a downturn which took a stop near 1.3042 level. Anyhow, the pair kept the bulls entertained, maintaining a see-sawed performance in the Asian session.
Gradually, the Oil prices continued to slip as the Middle East tensions seemed to ease. Additionally, the US Oil Production also have restarted operations in the Gulf of Mexico. The Crude Oil Futures was trading near $56.70 bbl in the early hours, 7.4% below the six week high.
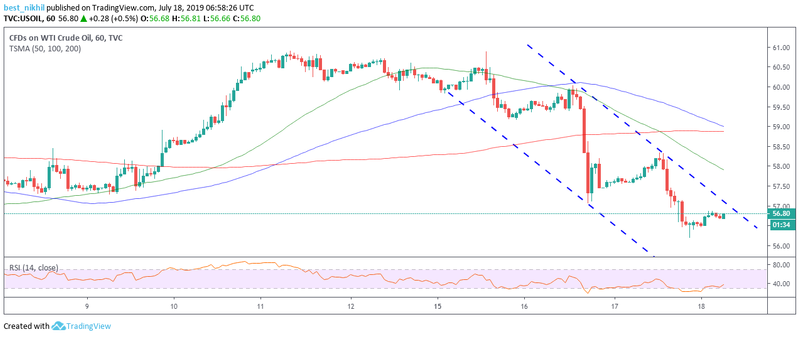
The “easing of tensions between the US and Iran, mixed Chinese growth data and storm-hit operations getting back online are all pressuring oil prices downward,” said Alfonso Esparza, Senior Market Analyst at OANDA.
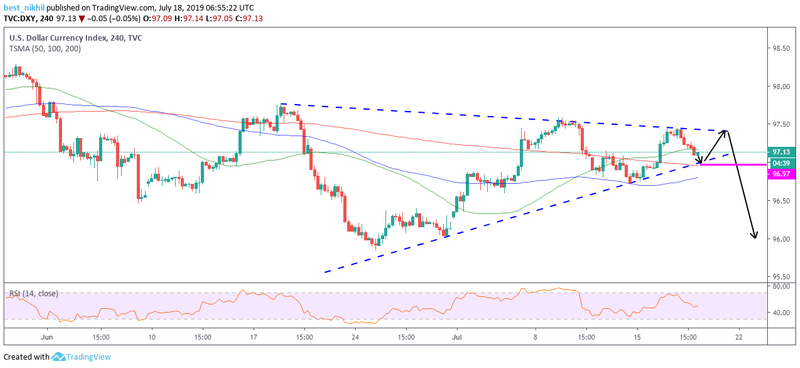
On the Greenback front, the 1-month old symmetrical triangle might play its role at any point in time, dragging down the Index, thereby USD/CAD pair. The USD Index might test the pivotal 96.97 level/200-day SMA, on moving further downward.
Significant Economic Events
At the top of today’s watchlist, traders look for the US Jobless Claim reports. The market stays slightly bullish over the Continuing Jobless Claims computed since July 5, expecting a 23K decline this time. Anyhow, the stance remains bearish over the Initial Jobless Claims calculated since July 12, hoping a 5K rise. Apart from the Unemployment data, the July Philadelphia Fed Manufacturing Survey is something quite influential. The Street estimates this Survey data to report 5.0 points over the previous 0.3 points.
There are no oil-catalyst events today. However, the June Canadian ADP Employment Change might put efforts to tweak pair’s daily movements. This ADP report had recorded -16K last time.
Technical Analysis
1-Day Chart
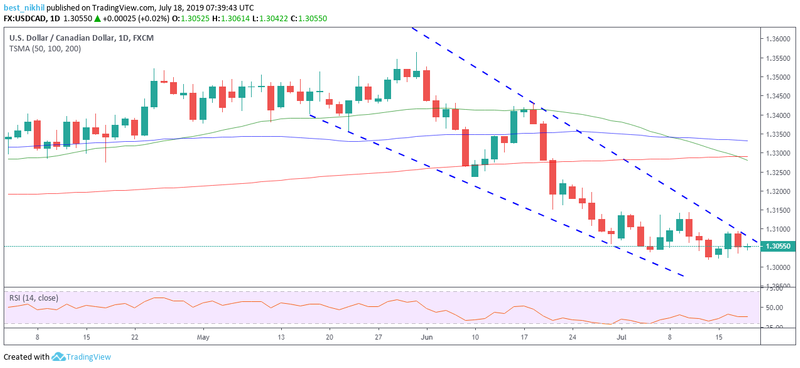
The Loonie pair was forming a falling wedge bullish trading pattern. Hence, the traders can wait for a breakout at the end of this pattern in the near-term. Notably, the 50-day short-term SMA was heading south, targeting the USD/CAD pair. So, at any point in time, things might reverse its course of action, taking the pair to the buyer’s territory.
4-Hour Chart

On a comparatively magnified view, the pair seem to have already broken a 1-month old major counter trendline. Anyhow, the intensity involved in the breaching fails to appeal for a valid breakout. However, the above-the-head resistance conflux made up of the 50-day, and 100-day SMA continues to remain firm, confining the upside. A triumphant march above this aforementioned resistance conflux would activate the 200-day SMA stalled near 1.3200 psychological mark.
This article was originally posted on FX Empire
