
 Yahoo Finance
 USD/CAD – Canadian Dollar Flat, BoC Rate Decision Looms
USD/CAD continues to trade sideways this week. In the North American session, the pair is trading at 1.3300, down 0.05% on the day.
BoC Expected to Stand Pat
The Bank of Canada holds its monthly policy meeting on Wednesday. The bank has pegged the benchmark rate at 1.75% for over a year, and no change is expected at the upcoming meeting. The Canadian economy is expected to grow by 1.3% in the third quarter, a much weaker figure than the robust clip of 3.7% in Q2. The global trade war continues to take a toll on exports and business investment, and high levels of household debt is likely to constrain consumer spending. As well inflation remains at low levels. This means that the bank needn’t worry about the economy overheating if it reduces rates, which remains a possibility in early 2020. Investors will be combing through the rate statement on Wednesday – a dovish message from policymakers could dampen sentiment towards the Canadian dollar and send USD/CAD higher.
Technical Analysis
USD/CAD is currently trading at the 1.33 line. This line has proven quite resilient, as the pair has tested it since mid-November but has been unable to sustain a breakout and move deeper into 1.33 territory. On the upside, 1.3330 is the next resistance line, followed by 1.3385.
On the downside, note that the 50-EMA and 200-EMA lines are almost touching. The 200-EMA is at 1.3239 and the 50-EMA follows closely at 1.3236. If the 50-EMA crosses above the 200-EMA, this crossover, known as a ‘golden cross’, is a bullish sign for the pair.

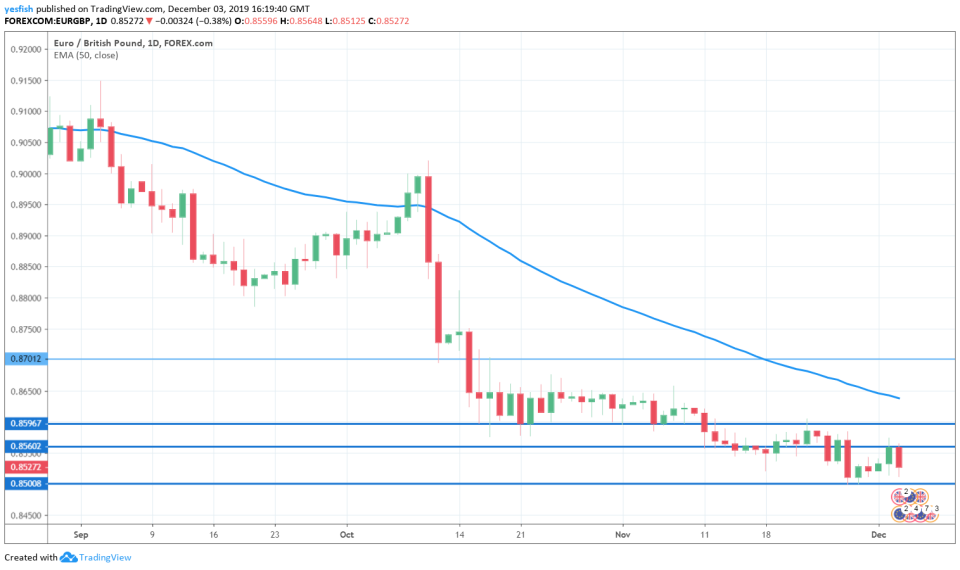
EUR/GBP
EUR/GBP has lost ground on Tuesday, reversing the gains seen on Monday. Currently, the pair is trading at 0.8529, down 0.36% on the day.
On the fundamental front, British Construction PMI improved to 45.3, marking a four-month high. This figure beat the estimate of 44.5 and boosted the pound against the euro.
Technical Analysis
EUR/GBP is showing stronger movement this week, but the pair remains range-bound. The 0.8560 line, which has remained relevant since mid-November, is an immediate resistance line. Above, we find resistance at 0.8590. This is followed by the 200-EMA line, which is at 0.8638. This is followed by resistance at the round number of 0.8700. On the downside, 0.8520 is under strong pressure. This line is protecting the major support level of 0.8500.
This article was originally posted on FX Empire
