
 Yahoo Finance
 Will US Output Growth Aid Marathon Oil (MRO) in Q2 Earnings?
Marathon Oil Corporation MRO is set to report second-quarter 2019 financial results on Aug 7, after the closing bell. The Zacks Consensus Estimate for the to-be-reported quarter is pegged at earnings per share of 11 cents on revenues of $1.36 billion.
In the last reported quarter, the company delivered an impressive positive earnings surprise of 416.67% on the back of better-than-expected production from the U.S Exploration and Production (E&P) segment. The company boasts an encouraging earnings surprise history. It surpassed estimates in three of the last four quarters, with average positive surprise of 105.87%.
Marathon Oil Corporation Price and EPS Surprise
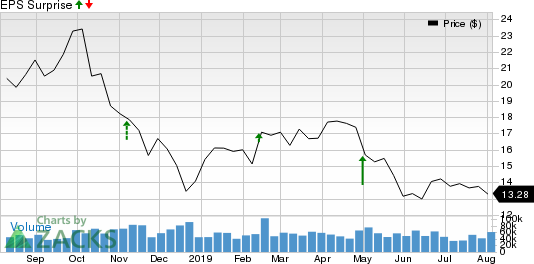
Marathon Oil Corporation price-eps-surprise | Marathon Oil Corporation Quote
Investors are keeping their fingers crossed and hoping that the company can surpass earnings estimates this time around as well. However, our model indicates that Marathon Oil might not beat on earnings in the to-be-reported quarter.
Let’s see which way top and bottom-line estimates are trending this time around.
The Zacks Consensus Estimate for revenues is pegged at $1,359 million, indicating a decline from $1,417 million recorded in the prior-year quarter. The Zacks Consensus Estimate for second-quarter earnings of 11 cents per share also suggests a fall from 15 cents recorded in the corresponding quarter of the prior year. Earnings estimates for the to-be-reported quarter have been revised downward by 7 cents in the past 30 days.
Let’s delve deeper and find out the factors likely to impact the upcoming results.
Factors at Play
Driven by key low cost-high margin U.S. resource shale plays like Permian, Eagle Ford and Bakken, the company expects second-quarter U.S. output to buoy earnings. The Zacks Consensus Estimate for net sales volumes from the U.S. E&P segment is pegged at 314 barrels of oil equivalent per day (Boe/d), indicating an increase from 298 Boe/d in the year-ago period.
While Marathon Oil expects to reap profits from output growth in the U.S. E&P segment, the international market is likely to bear the brunt of contracting volumes in the second quarter. As it is, output from the International E&P unit has been declining over several quarters and the trend is likely to continue this season as well,amid downtime at the Foinaven complex. Evidently, the Zacks Consensus Estimate for net sales volumes for the International segment is pegged at 101 Boe/d, implying a decrease from 121 Boe/d recorded in the year-ago-quarter.
We remain concerned about oil and gas prices that declined y/y in the quarter to be reported amid rising fuel inventories, slowdown of global economy and trade tensions. Notably, the Zacks Consensus estimate for price realization of oil, which constitutes majority of the firm’s volumes, is pegged at $59 a barrel, pointing to a decline from the year-ago realization of $66.
Hence, while higher y/y output from the U.S. E&P segment bodes well for the upcoming results, lower volumes from the International segment along with weaker y/y commodity prices may play spoilsports.
Earnings Whispers
Our proven model does not conclusively predict that Marathon Oil will beat the Zacks Consensus Estimate in the quarter to be reported. This is because it doesn’t have the right combination of the two key ingredients — a positive Earnings ESP and a Zacks Rank #3 (Hold) or higher — for increasing the odds of an earnings beat.
You can uncover the best stocks to buy or sell before they’re reported with our Earnings ESP Filter.
Earnings ESP: Earnings ESP, which represents the difference between the Most Accurate Estimate and the Zacks Consensus Estimate, is -3.20%.
Zacks Rank: Marathon Oil currently has a Zacks Rank #3, which increases the predictive power of ESP. But we also need to have a positive Earnings ESP to be confident of a positive surprise.
Note that we caution against stocks with a Zacks Ranks #4 or 5 (Sell rated) going into an earnings announcement, especially when the company is seeing a negative estimate revision momentum.
Stocks to Consider
While earnings beat looks uncertain for Marathon Oil, here are some firms from the energy space that you may want to consider on the basis of our model, which shows that these have the right combination of elements to post an earnings beat in the upcoming quarterly reports:
NuStar Energy L.P. NS is set to report second-quarter 2019 earnings on Aug 8. The stock has an Earnings ESP of +14.58% and a Zacks Rank #3. You can see the complete list of today’s Zacks #1 Rank stocks here.
Cheniere Energy, Inc. LNG is set to report second-quarter 2019 earnings on Aug 8. The stock has an Earnings ESP of +88.46% and a Zacks Rank #2 (Buy).
Targa Resources Corp. TRGP is set to report second-quarter 2019 earnings on Aug 8. The stock has an Earnings ESP of +0.03% and a Zacks Rank #3.
Today's Best Stocks from Zacks
Would you like to see the updated picks from our best market-beating strategies? From 2017 through 2018, while the S&P 500 gained +15.8%, five of our screens returned +38.0%, +61.3%, +61.6%, +68.1%, and +98.3%.
This outperformance has not just been a recent phenomenon. From 2000 – 2018, while the S&P averaged +4.8% per year, our top strategies averaged up to +56.2% per year.
See their latest picks free >>
Want the latest recommendations from Zacks Investment Research? Today, you can download 7 Best Stocks for the Next 30 Days. Click to get this free report
Targa Resources, Inc. (TRGP) : Free Stock Analysis Report
NuStar Energy L.P. (NS) : Free Stock Analysis Report
Cheniere Energy, Inc. (LNG) : Free Stock Analysis Report
Marathon Oil Corporation (MRO) : Free Stock Analysis Report
To read this article on Zacks.com click here.
Zacks Investment Research
