
 Yahoo Finance
 US Dollar Rebound at Risk, Crude Oil and Gold Continue to Sink
Talking Points:
US Dollar Chart Positioning Warns Rebound May Be Ending
S&P 500 Continues to Break Resistance, Targeting April Top
Crude Oil, Gold Prices Continue to Sink Past Chart Barriers
Can’t access to the Dow Jones FXCM US Dollar Index? Try the USD basket on Mirror Trader. **
US DOLLAR TECHNICAL ANALYSIS – Prices put in a Bearish Engulfing candlestick pattern below support-turned-resistance at the bottom of a falling channel set from mid-February, hinting a move lower may be ahead. Initial support is at 10430, the 23.6% Fibonacci expansion, with a break below that targeting the 38.2% level at 10405. A turn above resistance aims for the top of a larger falling channel in play since the beginning of the year, now at 10517.

Daily Chart - Created Using FXCM Marketscope 2.0
** The Dow Jones FXCM US Dollar Index and the Mirror Trader USD basket are not the same product.
S&P 500 TECHNICAL ANALYSIS – Prices rebounded as expected after putting in a Piercing Line candlestick pattern. A break above the 38.2% Fibonacci expansion at 1870.70 has exposed the 50% level at 1889.70, with a further push beyond that eyeing the 61.8% Fib at 1908.70.Alternatively, a reversal back below 1870.70 targets the 23.6% expansion at 1847.10.
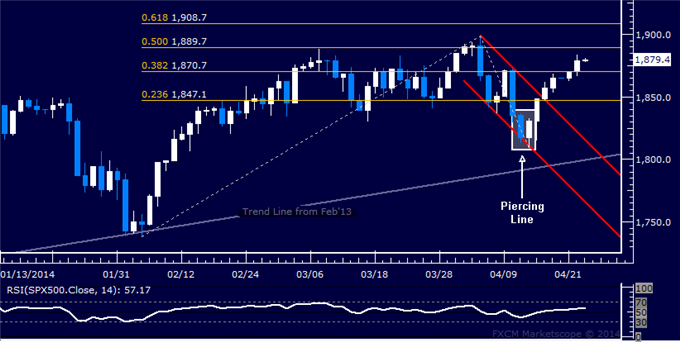
Daily Chart - Created Using FXCM Marketscope 2.0
GOLD TECHNICAL ANALYSIS – Prices continue to edge lower, taking out support at 1287.14 marked by the 38.2% Fibonacci expansion and exposing the 50% level at 1273.57. A further push beneath that aims for the 61.8% Fib at 1260.01. Alternatively, a reversal back above 1287.14 sees the first layer of resistance at 1303.93, the 23.6% expansion.
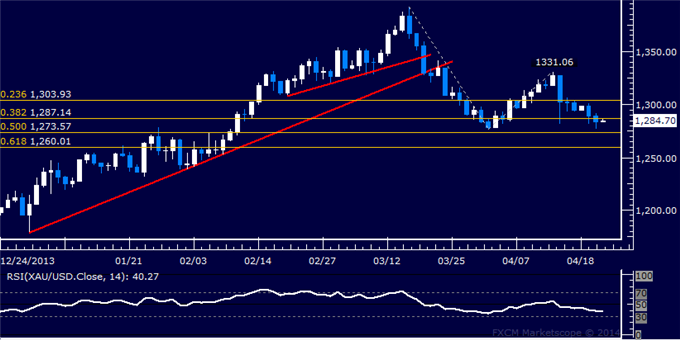
Daily Chart - Created Using FXCM Marketscope 2.0
CRUDE OIL TECHNICAL ANALYSIS – Prices are turned sharply lower below the 105.00 figure, sinking to challenge support at 101.04 marked by the 50% Fibonacci expansion. A break below this boundary initially exposes the 61.8% level at 100.11. Near-term resistance is at 101.96, the 38.2% Fib, followed by the 23.6% expansion at 103.11.
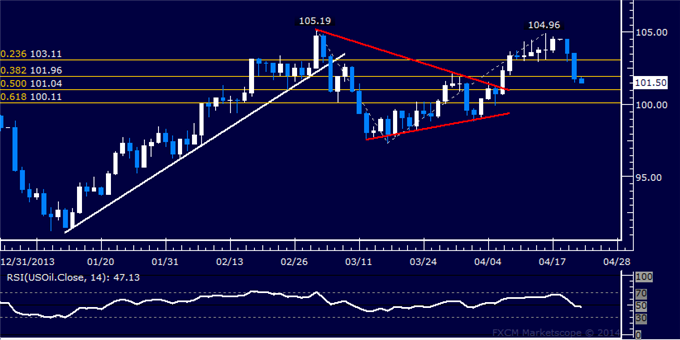
Daily Chart - Created Using FXCM Marketscope 2.0
--- Written by Ilya Spivak, Currency Strategist for DailyFX.com
To receive Ilya's analysis directly via email, please SIGN UP HERE
Contact and follow Ilya on Twitter: @IlyaSpivak
DailyFX provides forex news and technical analysis on the trends that influence the global currency markets.
Learn forex trading with a free practice account and trading charts from FXCM.
