
 Yahoo Finance
 US Dollar Nears Technical Crossroads, Crude Oil Flounders Sub-105.00
Talking Points:
US Dollar Moves to Test Decisive Chart Resistance Barrier
S&P 500 Rebound Stalls After Four Consecutive Advances
Crude Oil Flounders Below $105.00, Gold Edging Lower
Can’t access to the Dow Jones FXCM US Dollar Index? Try the USD basket on Mirror Trader. **
US DOLLAR TECHNICAL ANALYSIS – Prices began to recover as expected afterputting in a bullish Piercing Line candlestick pattern. Initial resistance lines up in the 10470-84 area, marked by the underside of a previously broken falling channel and the 23.6% Fib retracement. A break above the latter barrier targets the 38.2% Fib at 10536. Near-term support is at 10400, the April 10 low.
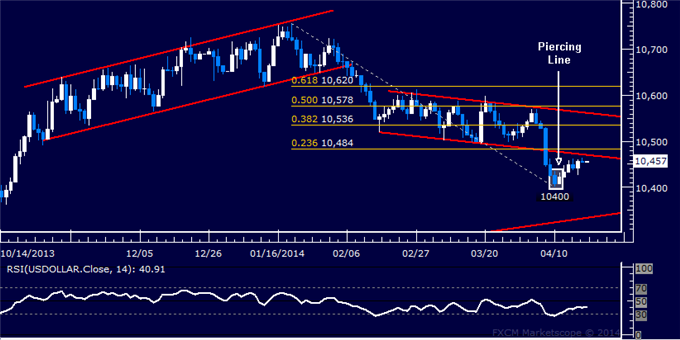
Daily Chart - Created Using FXCM Marketscope 2.0
** The Dow Jones FXCM US Dollar Index and the Mirror Trader USD basket are not the same product.
S&P 500 TECHNICAL ANALYSIS – Prices rebounded as expected after putting in a Piercing Line candlestick pattern. Buyers are now poised to challenge the 38.2% Fibonacci expansion at 1870.70, with a break above that exposing the 50% level at 1889.70.Near-term support is at 1847.10, the 23.6% Fib, followed by the previously broken top of a rising channel at 1827.90.
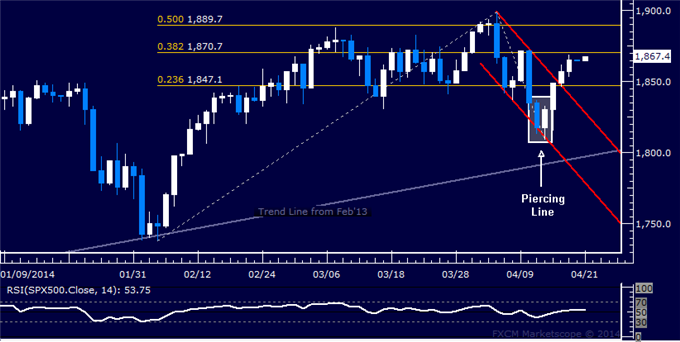
Daily Chart - Created Using FXCM Marketscope 2.0
GOLD TECHNICAL ANALYSIS – Prices reversed sharply downward, edging past support at 1303.93 marked by the 23.6% Fibonacci expansion and exposing the 38.2% level at 1287.14. A further push beneath that aims for the 50% Fib at 1273.57. Alternatively, a reversal back above 1303.93 sees the first layer of resistance at 1331.06, the April 15 high.
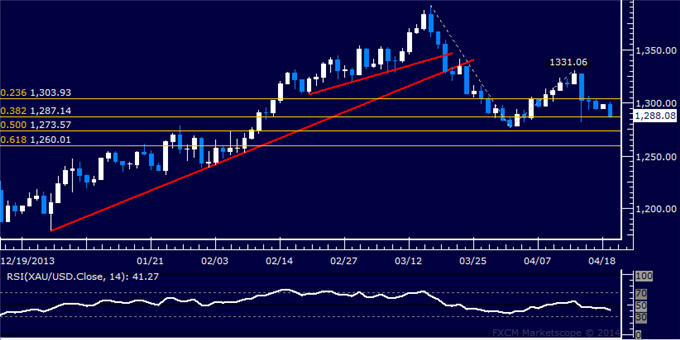
Daily Chart - Created Using FXCM Marketscope 2.0
CRUDE OIL TECHNICAL ANALYSIS – Prices turned sharply lower below the 105.00 figure, sinking to challenge support at 103.11 marked by the 23.6% Fibonacci expansion. A break below this boundary initially exposes the 38.2% level at 101.96. Near-term resistance is at 104.96, the April 16 high.
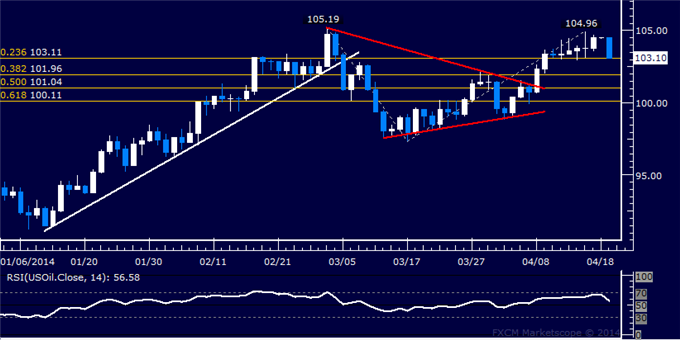
Daily Chart - Created Using FXCM Marketscope 2.0
--- Written by Ilya Spivak, Currency Strategist for DailyFX.com
To receive Ilya's analysis directly via email, please SIGN UP HERE
Contact and follow Ilya on Twitter: @IlyaSpivak
DailyFX provides forex news and technical analysis on the trends that influence the global currency markets.
Learn forex trading with a free practice account and trading charts from FXCM.
