
 Yahoo Finance
 Universal Display (NASDAQ:OLED) Shareholders Have Enjoyed A Whopping 632% Share Price Gain

Buying shares in the best businesses can build meaningful wealth for you and your family. While the best companies are hard to find, but they can generate massive returns over long periods. Don't believe it? Then look at the Universal Display Corporation (NASDAQ:OLED) share price. It's 632% higher than it was five years ago. If that doesn't get you thinking about long term investing, we don't know what will. The last week saw the share price soften some 2.3%.
Anyone who held for that rewarding ride would probably be keen to talk about it.
Check out our latest analysis for Universal Display
While markets are a powerful pricing mechanism, share prices reflect investor sentiment, not just underlying business performance. By comparing earnings per share (EPS) and share price changes over time, we can get a feel for how investor attitudes to a company have morphed over time.
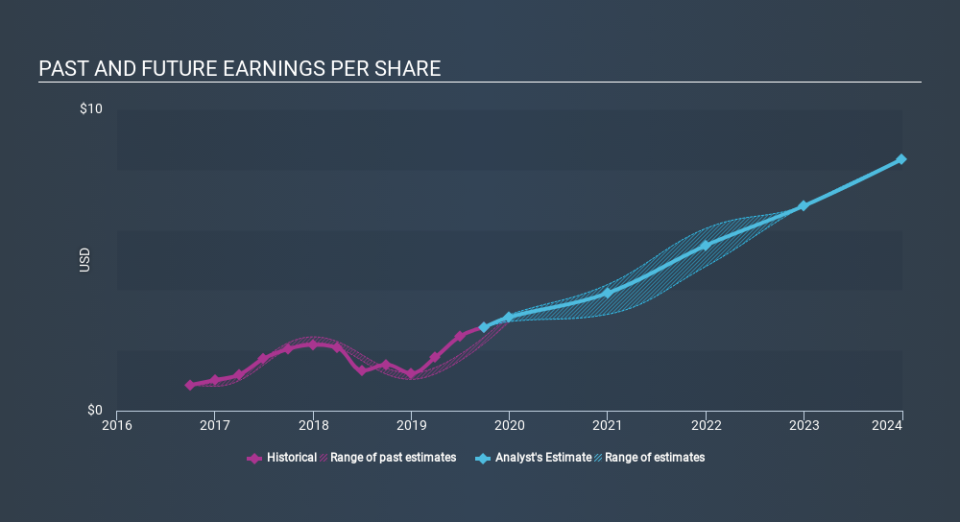
During five years of share price growth, Universal Display achieved compound earnings per share (EPS) growth of 8.2% per year. This EPS growth is lower than the 49% average annual increase in the share price. This suggests that market participants hold the company in higher regard, these days. That's not necessarily surprising considering the five-year track record of earnings growth. This optimism is visible in its fairly high P/E ratio of 68.21.
The company's earnings per share (over time) is depicted in the image below (click to see the exact numbers).
We know that Universal Display has improved its bottom line over the last three years, but what does the future have in store? This free interactive report on Universal Display's balance sheet strength is a great place to start, if you want to investigate the stock further.
What About Dividends?
When looking at investment returns, it is important to consider the difference between total shareholder return (TSR) and share price return. The TSR is a return calculation that accounts for the value of cash dividends (assuming that any dividend received was reinvested) and the calculated value of any discounted capital raisings and spin-offs. Arguably, the TSR gives a more comprehensive picture of the return generated by a stock. In the case of Universal Display, it has a TSR of 636% for the last 5 years. That exceeds its share price return that we previously mentioned. And there's no prize for guessing that the dividend payments largely explain the divergence!
A Different Perspective
We're pleased to report that Universal Display shareholders have received a total shareholder return of 99% over one year. And that does include the dividend. That's better than the annualised return of 49% over half a decade, implying that the company is doing better recently. In the best case scenario, this may hint at some real business momentum, implying that now could be a great time to delve deeper. Most investors take the time to check the data on insider transactions. You can click here to see if insiders have been buying or selling.
If you like to buy stocks alongside management, then you might just love this free list of companies. (Hint: insiders have been buying them).
Please note, the market returns quoted in this article reflect the market weighted average returns of stocks that currently trade on US exchanges.
If you spot an error that warrants correction, please contact the editor at editorial-team@simplywallst.com. This article by Simply Wall St is general in nature. It does not constitute a recommendation to buy or sell any stock, and does not take account of your objectives, or your financial situation. Simply Wall St has no position in the stocks mentioned.
We aim to bring you long-term focused research analysis driven by fundamental data. Note that our analysis may not factor in the latest price-sensitive company announcements or qualitative material. Thank you for reading.
