
 Yahoo Finance
 Universal Display Corporation (NASDAQ:OLED) Is Employing Capital Very Effectively

Today we'll evaluate Universal Display Corporation (NASDAQ:OLED) to determine whether it could have potential as an investment idea. Specifically, we're going to calculate its Return On Capital Employed (ROCE), in the hopes of getting some insight into the business.
First, we'll go over how we calculate ROCE. Next, we'll compare it to others in its industry. Then we'll determine how its current liabilities are affecting its ROCE.
What is Return On Capital Employed (ROCE)?
ROCE measures the amount of pre-tax profits a company can generate from the capital employed in its business. All else being equal, a better business will have a higher ROCE. Ultimately, it is a useful but imperfect metric. Renowned investment researcher Michael Mauboussin has suggested that a high ROCE can indicate that 'one dollar invested in the company generates value of more than one dollar'.
So, How Do We Calculate ROCE?
Analysts use this formula to calculate return on capital employed:
Return on Capital Employed = Earnings Before Interest and Tax (EBIT) ÷ (Total Assets - Current Liabilities)
Or for Universal Display:
0.14 = US$124m ÷ (US$1.0b - US$140m) (Based on the trailing twelve months to June 2019.)
Therefore, Universal Display has an ROCE of 14%.
Check out our latest analysis for Universal Display
Is Universal Display's ROCE Good?
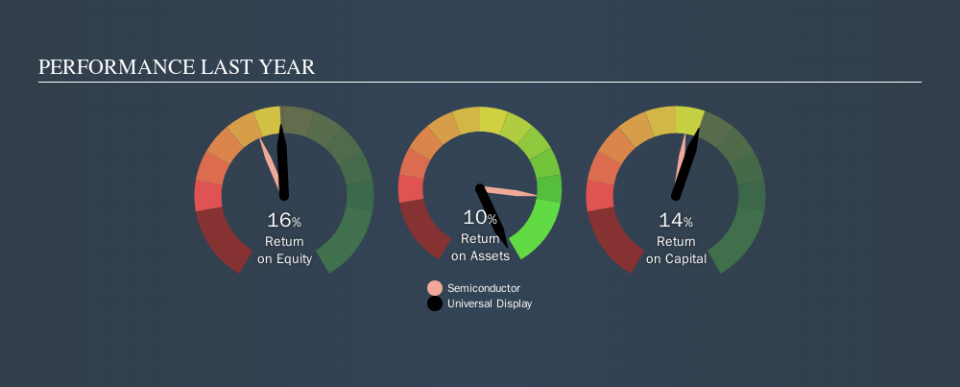
When making comparisons between similar businesses, investors may find ROCE useful. Using our data, we find that Universal Display's ROCE is meaningfully better than the 10% average in the Semiconductor industry. I think that's good to see, since it implies the company is better than other companies at making the most of its capital. Regardless of where Universal Display sits next to its industry, its ROCE in absolute terms appears satisfactory, and this company could be worth a closer look.
The image below shows how Universal Display's ROCE compares to its industry, and you can click it to see more detail on its past growth.
It is important to remember that ROCE shows past performance, and is not necessarily predictive. Companies in cyclical industries can be difficult to understand using ROCE, as returns typically look high during boom times, and low during busts. ROCE is, after all, simply a snap shot of a single year. Future performance is what matters, and you can see analyst predictions in our free report on analyst forecasts for the company.
Universal Display's Current Liabilities And Their Impact On Its ROCE
Current liabilities are short term bills and invoices that need to be paid in 12 months or less. The ROCE equation subtracts current liabilities from capital employed, so a company with a lot of current liabilities appears to have less capital employed, and a higher ROCE than otherwise. To check the impact of this, we calculate if a company has high current liabilities relative to its total assets.
Universal Display has total liabilities of US$140m and total assets of US$1.0b. As a result, its current liabilities are equal to approximately 14% of its total assets. Low current liabilities are not boosting the ROCE too much.
What We Can Learn From Universal Display's ROCE
This is good to see, and with a sound ROCE, Universal Display could be worth a closer look. Universal Display shapes up well under this analysis, but it is far from the only business delivering excellent numbers . You might also want to check this free collection of companies delivering excellent earnings growth.
If you like to buy stocks alongside management, then you might just love this free list of companies. (Hint: insiders have been buying them).
We aim to bring you long-term focused research analysis driven by fundamental data. Note that our analysis may not factor in the latest price-sensitive company announcements or qualitative material.
If you spot an error that warrants correction, please contact the editor at editorial-team@simplywallst.com. This article by Simply Wall St is general in nature. It does not constitute a recommendation to buy or sell any stock, and does not take account of your objectives, or your financial situation. Simply Wall St has no position in the stocks mentioned. Thank you for reading.
