
 Yahoo Finance
 We Like These Underlying Return On Capital Trends At SolarWinds (NYSE:SWI)
If we want to find a potential multi-bagger, often there are underlying trends that can provide clues. Firstly, we'd want to identify a growing return on capital employed (ROCE) and then alongside that, an ever-increasing base of capital employed. This shows us that it's a compounding machine, able to continually reinvest its earnings back into the business and generate higher returns. With that in mind, we've noticed some promising trends at SolarWinds (NYSE:SWI) so let's look a bit deeper.
What Is Return On Capital Employed (ROCE)?
Just to clarify if you're unsure, ROCE is a metric for evaluating how much pre-tax income (in percentage terms) a company earns on the capital invested in its business. Analysts use this formula to calculate it for SolarWinds:
Return on Capital Employed = Earnings Before Interest and Tax (EBIT) ÷ (Total Assets - Current Liabilities)
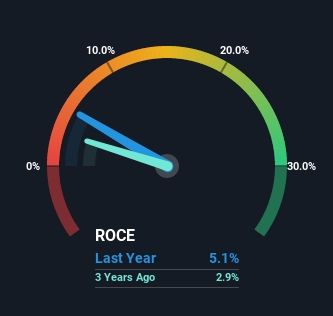
0.051 = US$140m ÷ (US$3.2b - US$430m) (Based on the trailing twelve months to March 2023).
Therefore, SolarWinds has an ROCE of 5.1%. Ultimately, that's a low return and it under-performs the Software industry average of 10%.
See our latest analysis for SolarWinds
Above you can see how the current ROCE for SolarWinds compares to its prior returns on capital, but there's only so much you can tell from the past. If you're interested, you can view the analysts predictions in our free report on analyst forecasts for the company.
What Can We Tell From SolarWinds' ROCE Trend?
You'd find it hard not to be impressed with the ROCE trend at SolarWinds. The data shows that returns on capital have increased by 190% over the trailing five years. The company is now earning US$0.05 per dollar of capital employed. In regards to capital employed, SolarWinds appears to been achieving more with less, since the business is using 44% less capital to run its operation. SolarWinds may be selling some assets so it's worth investigating if the business has plans for future investments to increase returns further still.
The Key Takeaway
In the end, SolarWinds has proven it's capital allocation skills are good with those higher returns from less amount of capital. And since the stock has fallen 48% over the last three years, there might be an opportunity here. So researching this company further and determining whether or not these trends will continue seems justified.
On a separate note, we've found 1 warning sign for SolarWinds you'll probably want to know about.
If you want to search for solid companies with great earnings, check out this free list of companies with good balance sheets and impressive returns on equity.
Have feedback on this article? Concerned about the content? Get in touch with us directly. Alternatively, email editorial-team (at) simplywallst.com.
This article by Simply Wall St is general in nature. We provide commentary based on historical data and analyst forecasts only using an unbiased methodology and our articles are not intended to be financial advice. It does not constitute a recommendation to buy or sell any stock, and does not take account of your objectives, or your financial situation. We aim to bring you long-term focused analysis driven by fundamental data. Note that our analysis may not factor in the latest price-sensitive company announcements or qualitative material. Simply Wall St has no position in any stocks mentioned.
Join A Paid User Research Session
You’ll receive a US$30 Amazon Gift card for 1 hour of your time while helping us build better investing tools for the individual investors like yourself. Sign up here
