
 Yahoo Finance
 We Like These Underlying Return On Capital Trends At Restaurant Brands International Limited Partnership (TSE:QSP.UN)
To find a multi-bagger stock, what are the underlying trends we should look for in a business? Ideally, a business will show two trends; firstly a growing return on capital employed (ROCE) and secondly, an increasing amount of capital employed. If you see this, it typically means it's a company with a great business model and plenty of profitable reinvestment opportunities. So when we looked at Restaurant Brands International Limited Partnership (TSE:QSP.UN) and its trend of ROCE, we really liked what we saw.
Understanding Return On Capital Employed (ROCE)
For those that aren't sure what ROCE is, it measures the amount of pre-tax profits a company can generate from the capital employed in its business. To calculate this metric for Restaurant Brands International Limited Partnership, this is the formula:
Return on Capital Employed = Earnings Before Interest and Tax (EBIT) ÷ (Total Assets - Current Liabilities)
0.097 = US$2.0b ÷ (US$23b - US$1.9b) (Based on the trailing twelve months to September 2022).
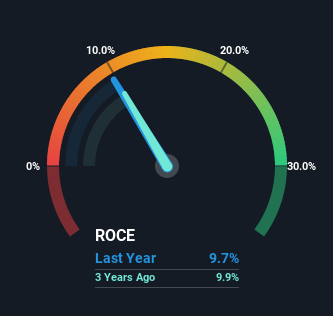
Thus, Restaurant Brands International Limited Partnership has an ROCE of 9.7%. On its own that's a low return on capital but it's in line with the industry's average returns of 9.6%.
Check out our latest analysis for Restaurant Brands International Limited Partnership
While the past is not representative of the future, it can be helpful to know how a company has performed historically, which is why we have this chart above. If you want to delve into the historical earnings, revenue and cash flow of Restaurant Brands International Limited Partnership, check out these free graphs here.
What Does the ROCE Trend For Restaurant Brands International Limited Partnership Tell Us?
Restaurant Brands International Limited Partnership's ROCE growth is quite impressive. Looking at the data, we can see that even though capital employed in the business has remained relatively flat, the ROCE generated has risen by 22% over the last five years. So it's likely that the business is now reaping the full benefits of its past investments, since the capital employed hasn't changed considerably. On that front, things are looking good so it's worth exploring what management has said about growth plans going forward.
The Bottom Line
To bring it all together, Restaurant Brands International Limited Partnership has done well to increase the returns it's generating from its capital employed. Investors may not be impressed by the favorable underlying trends yet because over the last five years the stock has only returned 34% to shareholders. So with that in mind, we think the stock deserves further research.
If you want to know some of the risks facing Restaurant Brands International Limited Partnership we've found 4 warning signs (3 shouldn't be ignored!) that you should be aware of before investing here.
If you want to search for solid companies with great earnings, check out this free list of companies with good balance sheets and impressive returns on equity.
Have feedback on this article? Concerned about the content? Get in touch with us directly. Alternatively, email editorial-team (at) simplywallst.com.
This article by Simply Wall St is general in nature. We provide commentary based on historical data and analyst forecasts only using an unbiased methodology and our articles are not intended to be financial advice. It does not constitute a recommendation to buy or sell any stock, and does not take account of your objectives, or your financial situation. We aim to bring you long-term focused analysis driven by fundamental data. Note that our analysis may not factor in the latest price-sensitive company announcements or qualitative material. Simply Wall St has no position in any stocks mentioned.
Join A Paid User Research Session
You’ll receive a US$30 Amazon Gift card for 1 hour of your time while helping us build better investing tools for the individual investors like yourself. Sign up here
