
 Yahoo Finance
 We Like These Underlying Return On Capital Trends At Perfect (NYSE:PERF)
Finding a business that has the potential to grow substantially is not easy, but it is possible if we look at a few key financial metrics. Firstly, we'd want to identify a growing return on capital employed (ROCE) and then alongside that, an ever-increasing base of capital employed. Put simply, these types of businesses are compounding machines, meaning they are continually reinvesting their earnings at ever-higher rates of return. With that in mind, we've noticed some promising trends at Perfect (NYSE:PERF) so let's look a bit deeper.
What Is Return On Capital Employed (ROCE)?
Just to clarify if you're unsure, ROCE is a metric for evaluating how much pre-tax income (in percentage terms) a company earns on the capital invested in its business. The formula for this calculation on Perfect is:
Return on Capital Employed = Earnings Before Interest and Tax (EBIT) ÷ (Total Assets - Current Liabilities)
0.00042 = US$78k ÷ (US$210m - US$25m) (Based on the trailing twelve months to December 2022).
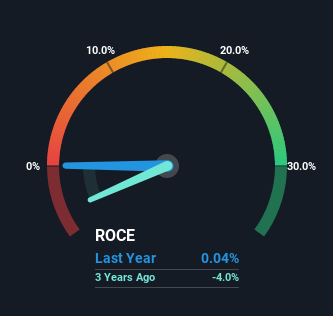
So, Perfect has an ROCE of 0.04%. Ultimately, that's a low return and it under-performs the Software industry average of 9.4%.
See our latest analysis for Perfect
Above you can see how the current ROCE for Perfect compares to its prior returns on capital, but there's only so much you can tell from the past. If you're interested, you can view the analysts predictions in our free report on analyst forecasts for the company.
How Are Returns Trending?
Perfect has recently broken into profitability so their prior investments seem to be paying off. The company was generating losses three years ago, but now it's earning 0.04% which is a sight for sore eyes. In addition to that, Perfect is employing 423% more capital than previously which is expected of a company that's trying to break into profitability. This can indicate that there's plenty of opportunities to invest capital internally and at ever higher rates, both common traits of a multi-bagger.
Our Take On Perfect's ROCE
Long story short, we're delighted to see that Perfect's reinvestment activities have paid off and the company is now profitable. Astute investors may have an opportunity here because the stock has declined 36% in the last year. So researching this company further and determining whether or not these trends will continue seems justified.
On the other side of ROCE, we have to consider valuation. That's why we have a FREE intrinsic value estimation on our platform that is definitely worth checking out.
If you want to search for solid companies with great earnings, check out this free list of companies with good balance sheets and impressive returns on equity.
Have feedback on this article? Concerned about the content? Get in touch with us directly. Alternatively, email editorial-team (at) simplywallst.com.
This article by Simply Wall St is general in nature. We provide commentary based on historical data and analyst forecasts only using an unbiased methodology and our articles are not intended to be financial advice. It does not constitute a recommendation to buy or sell any stock, and does not take account of your objectives, or your financial situation. We aim to bring you long-term focused analysis driven by fundamental data. Note that our analysis may not factor in the latest price-sensitive company announcements or qualitative material. Simply Wall St has no position in any stocks mentioned.
Join A Paid User Research Session
You’ll receive a US$30 Amazon Gift card for 1 hour of your time while helping us build better investing tools for the individual investors like yourself. Sign up here
