
 Yahoo Finance
 We Like These Underlying Return On Capital Trends At Continental Resources (NYSE:CLR)
Finding a business that has the potential to grow substantially is not easy, but it is possible if we look at a few key financial metrics. Typically, we'll want to notice a trend of growing return on capital employed (ROCE) and alongside that, an expanding base of capital employed. Basically this means that a company has profitable initiatives that it can continue to reinvest in, which is a trait of a compounding machine. So when we looked at Continental Resources (NYSE:CLR) and its trend of ROCE, we really liked what we saw.
What is Return On Capital Employed (ROCE)?
For those who don't know, ROCE is a measure of a company's yearly pre-tax profit (its return), relative to the capital employed in the business. The formula for this calculation on Continental Resources is:
Return on Capital Employed = Earnings Before Interest and Tax (EBIT) ÷ (Total Assets - Current Liabilities)
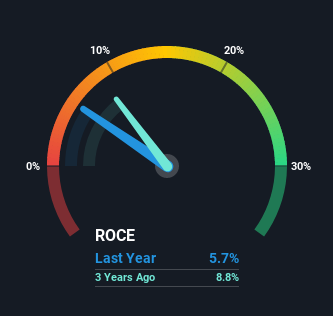
0.057 = US$784m ÷ (US$15b - US$1.2b) (Based on the trailing twelve months to June 2021).
So, Continental Resources has an ROCE of 5.7%. In absolute terms, that's a low return but it's around the Oil and Gas industry average of 6.9%.
View our latest analysis for Continental Resources
In the above chart we have measured Continental Resources' prior ROCE against its prior performance, but the future is arguably more important. If you're interested, you can view the analysts predictions in our free report on analyst forecasts for the company.
The Trend Of ROCE
We're delighted to see that Continental Resources is reaping rewards from its investments and has now broken into profitability. The company was generating losses five years ago, but has managed to turn it around and as we saw earlier is now earning 5.7%, which is always encouraging. Interestingly, the capital employed by the business has remained relatively flat, so these higher returns are either from prior investments paying off or increased efficiencies. So while we're happy that the business is more efficient, just keep in mind that could mean that going forward the business is lacking areas to invest internally for growth. So if you're looking for high growth, you'll want to see a business's capital employed also increasing.
The Bottom Line On Continental Resources' ROCE
To sum it up, Continental Resources is collecting higher returns from the same amount of capital, and that's impressive. And given the stock has remained rather flat over the last five years, there might be an opportunity here if other metrics are strong. With that in mind, we believe the promising trends warrant this stock for further investigation.
Continental Resources does have some risks, we noticed 3 warning signs (and 1 which makes us a bit uncomfortable) we think you should know about.
While Continental Resources isn't earning the highest return, check out this free list of companies that are earning high returns on equity with solid balance sheets.
This article by Simply Wall St is general in nature. We provide commentary based on historical data and analyst forecasts only using an unbiased methodology and our articles are not intended to be financial advice. It does not constitute a recommendation to buy or sell any stock, and does not take account of your objectives, or your financial situation. We aim to bring you long-term focused analysis driven by fundamental data. Note that our analysis may not factor in the latest price-sensitive company announcements or qualitative material. Simply Wall St has no position in any stocks mentioned.
Have feedback on this article? Concerned about the content? Get in touch with us directly. Alternatively, email editorial-team (at) simplywallst.com.
