
 Yahoo Finance
 Under Armour (UAA) Stock Down on Loss in Transition Quarter
Shares of Under Armour, Inc. UAA plunged 23.8% during the trading session on May 6, following the company’s lackluster performance in the transition quarter ended Mar 31, 2022 and a muted outlook for fiscal 2023. The impact of supply chain disruptions and higher shipping costs was visible in the sportswear maker’s quarterly results. Also, the resurgence of COVID-19 in China and its related impacts hurt the company’s Asia Pacific business. However, revenues were up in North America.
This Zacks Rank #3 (Hold) stock has fallen 45.6% in the past three months compared with the industry’s decline of 21%.
Last year in February, Under Armour's board of directors authorized a change in the fiscal year end from Dec 31 to Mar 31, effective fiscal year beginning Apr 1, 2022. Management also informed that following a three-month transition period (Jan 1-Mar 31, 2022), Under Armour's fiscal 2023 will run from Apr 1, 2022, through Mar 31, 2023. As a result, there will be no fiscal 2022.
Revenues & Earnings Picture
Under Armour reported an adjusted loss of 1 cent a share in the transition quarter against earnings of 16 cents in the year-ago period, thanks to lower-than-expected sales and margin contraction. The Zacks Consensus Estimate for earnings in the said quarter was 4 cents a share.
Meanwhile, net revenues of $1,300.9 million fell short of the Zacks Consensus Estimate of $1,334 million but grew 3.5% on a year-over-year basis. While wholesale revenues increased 4% year over year to $829 million, direct-to-consumer revenues rose 1% to $441 million, driven by 2% growth in e-commerce. Owned and operated store revenue growth was flat during the quarter.
Under Armour, Inc. Price, Consensus and EPS Surprise
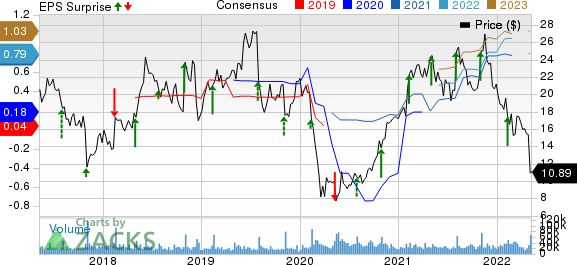
Under Armour, Inc. price-consensus-eps-surprise-chart | Under Armour, Inc. Quote
Let’s Take an Insight
By product category, Apparel revenues jumped 8.2% year over year to $876.6 million, while Footwear revenues decreased 4% to $296.7 million. Revenues from the Accessories category declined 17.5% to $96.8 million. Meanwhile, Licensing revenues surged 22.8% to $26.6 million.
Net revenues from North America increased 4.4% to $841.1 million. Revenues from international business grew 0.7% (or up 3.2% on a currency-neutral basis) to $456 million. Within international business, net revenues from EMEA increased 17.6% to $228.1 million. We note that revenues from Asia-Pacific and Latin America regions declined 13.5% and 5.5% to $181.9 million and $45.6 million, respectively.
The company’s gross margin shrunk 350 basis points to 46.5% from the prior-year period owing to elevated freight expenses. SG&A expenses jumped 16% to $594 million. Meanwhile, adjusted operating income of $10.7 million was significantly down from $114 million reported in the year-ago period.
Other Financial Details
Under Armour ended the transition quarter with cash and cash equivalents of $1,009.1 million, long-term debt (net of current maturities) of $672.3 million and total stockholders' equity of $1,729 million. Inventory was down 3% to $824 million.
In February 2022, Under Armour’s board of directors authorized the repurchase of up to $500 million of its outstanding Class C common stock. An initial $300 million of repurchases was completed in early May through an accelerated share repurchase plan. The company has about $200 million remaining under its share buyback program.
FY23 Outlook
Taking into account the ongoing supply chain bottleneck, pandemic-related uncertainties, and inflationary trends, Under Armour expects fiscal 2023 revenues to increase 5-7% versus the comparable baseline period (Apr 1, 2021, through Mar 31, 2022) revenues of $5.7 billion. This reflects a mid-single-digit growth rate in North America and a low-teens growth rate in the international business.
The guidance includes roughly three percentage points of headwinds related to management’s strategic decision to cancel orders affected by capacity issues, supply-chain delays, and emergent COVID-19 impacts in China.
Management foresees gross margin contraction of 150 to 200 basis points compared to the baseline period's adjusted gross margin of 49.6%. This indicates expected inflationary pressures on freight and product costs, an unfavorable channel mix, and changes in foreign currency.
The company guided operating income between $375 million and $400 million versus the comparable baseline period adjusted operating income of $424 million.
Under Armour projected adjusted earnings in the band of 63-68 cents a share, below the current Zack Consensus Estimate of 79 cents. The company had reported adjusted earnings of 68 cents a share for the comparable baseline period.
Pick These 3 Stocks
Here we highlight three top-ranked stocks, namely, Steven Madden SHOO, G-III Apparel GIII and Target TGT.
Steven Madden is a leading designer and marketer of fashion-forward footwear, accessories and apparel for women, men and children. The stock currently sports a Zacks Rank #1 (Strong Buy). You can see the complete list of today’s Zacks #1 Rank stocks here.
The Zacks Consensus Estimate for Steven Madden’s current financial year revenues and EPS suggests growth of 15.2% and 19.6%, respectively, from the year-ago reported figure. SHOO has a trailing four-quarter earnings surprise of 44%, on average.
G-III Apparel designs, sources and markets apparel and accessories under owned, licensed and private label brands. The stock currently carries a Zacks Rank #2 (Buy).
The Zacks Consensus Estimate for G-III Apparel’s current financial year revenues and EPS suggests growth of 10% and 5.4%, respectively, from the year-ago reported figure. G-III Apparel has a trailing four-quarter earnings surprise of 160.6%, on average.
General merchandise retailer Target currently carries a Zacks Rank #2. TGT has an expected EPS growth rate of 16.5% for three-five years.
The Zacks Consensus Estimate for Target’s current financial-year sales and EPS suggests growth of 3.7% and 7.3%, respectively, from the corresponding year-ago period’s levels. TGT has a trailing four-quarter earnings surprise of 21.3%, on average.
Want the latest recommendations from Zacks Investment Research? Today, you can download 7 Best Stocks for the Next 30 Days. Click to get this free report
Target Corporation (TGT) : Free Stock Analysis Report
GIII Apparel Group, LTD. (GIII) : Free Stock Analysis Report
Steven Madden, Ltd. (SHOO) : Free Stock Analysis Report
Under Armour, Inc. (UAA) : Free Stock Analysis Report
To read this article on Zacks.com click here.
Zacks Investment Research
