
 Yahoo Finance
 U.S. Global Investors Announces Sustainably Robust Quarter, with Average AUM Up 100% from the Same Period Last Year and Net Income at $0.16 Per Share, up 23% Year-Over-Year
U.S. Global Investors vs. Competition
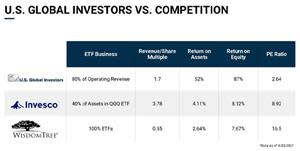
Source: U.S. Global Investors
USLUX Outperformed Its Index
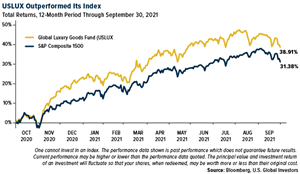
Source: Bloomberg, U.S. Global Investors
San Antonio, TX, Jan. 11, 2022 (GLOBE NEWSWIRE) -- U.S. Global Investors, Inc. (NASDAQ: GROW) (the “Company”), a registered investment advisory firm with longstanding experience in global markets and specialized sectors from gold mining to cryptocurrencies, today is pleased to report financial results for the fiscal quarter ended September 30, 2021.
For the three-month period, total operating revenues were $6.5 million, an increase of over 100% year-over-year (YoY). Net income for the quarter was $2.4 million, or $0.16 per share, an increase of 23% YoY. Average assets under management (AUM) for the three-month period ended September 30, 2021, were $4.0 billion, twice as much as the same period last year. Operating margin for the quarter was 44%, compared to 29% for the quarter ended September 30, 2020.
“I’m thrilled that U.S. Global Investors has remained a go-to fund shop for investors seeking strategic exposure to thematic sectors such as airlines, gold mining, luxury goods and crypto mining,” says Frank Holmes, CEO and Chief Investment Officer. “Later this month, we’ll be able to add shipping and cargo to that list when the U.S. Global Sea-to-Sky Cargo ETF, ticker SEA, begins trading. We’re excited to include this offering in our growing stable of innovative, quant-based exchange-traded funds, which also includes the U.S. Global Jets ETF (JETS) and U.S. Global GO GOLD and Precious Metal Miners ETF (GOAU).”
U.S. Global Investors Is Deeply Undervalued Relative to Peers
Management and the Company’s Board of Directors are reviewing strategies to unlock the deep value of the stock moving into 2022. “The ETF business continues to grow exponentially. I invite shareholders to explore the simple comparison table , showing GROW relative to other investment advisors of various sizes, that are also in the ETF space. Based on relative comparisons, I believe U.S. Global looks not only deeply undervalued, but also very attractive on a variety of metrics. I look forward to explaining in greater detail during our webcast on January 12,” explains Mr. Holmes.
JETS Trading Volume Has Remained Strong Despite New Variant
JETS continued to attract assets, ending the September quarter with $3.7 billion, an increase of more than 125% compared to the same quarter end in 2020. Despite concerns of new coronavirus variants disrupting commercial air travel, JETS trading volume has been strong. On December 6, 2021, the airlines ETF saw a new daily record in volume, with more than 33 million shares traded, representing over $716 million in value.
The Company remains optimistic that a full airline industry recovery can still take place in 2022, and a new forecast by Airlines for America (A4A) appears to support this. According to its most recent report, the U.S. trade group says it believes airline revenues could fully recover to 2019 levels by the second half of 2022. This projection is based largely on monthly sales data from the seven largest U.S. carriers. By the September quarter of 2022, ticket sales could be 3% above pre-pandemic levels, A4A believes.
“In the meantime, airlines continue to offset still-recovering ticket sales, not to mention higher fuel costs, with ancillary revenues,” explains Mr. Holmes. “Such revenues include sales of services that go beyond simply transporting someone from A to B. Think frequent flyer programs, credit card applications, hotel bookings, extra legroom and the like.”
As expected, ancillary revenues dipped dramatically in 2020, but like the airlines industry as a whole, ancillary revenues appear to have ticked up in 2021, as of November. According to IdeaWorks and CarTrawler, global ancillary fees are estimated to increase to $65.8 billion in 2021, or $7.7 billion more than last year.
Although ancillary revenues are still below 2019 levels, today they represent a larger share of total airline revenues than they did two years ago. In 2021, these fees represented an estimated 14.4% of total revenues, compared to 12.2% in 2019. A decade ago, they represented only 5.4% of global sales, underscoring just how important this revenue stream has become and will continue to be.
Gold Could Be the Ultimate Contrarian Investment Right Now
Compared to JETS, attracting new fund flows into GOAU has been more challenging. Nevertheless, the Company maintains its bullish position on the gold mining industry heading into 2022, especially as inflation in economies around the world has touched multi-year highs.
“Right now, gold is extremely unloved, making it, I believe, the ultimate contrarian asset to own,” comments Mr. Holmes. “A number of gold mining stocks also look very attractive at the moment, with many of them generating remarkably higher free cash flow (FCF) yield than the industry as a whole and the S&P 500. This number tells you how well a company can meet its financial obligations, pay down its debts and potentially raise dividends. There are quite a few gold producers that had exceptionally strong cash positions relative to the broader market, and we owned a number of them in the quarter ended September 30, 2021, either in GOAU, the Gold and Precious Metals Fund (USERX) and/or the World Precious Minerals Fund (UNWPX).”
Luxury Goods Fund Continued to Outperform
The Company continues to be pleased with the performance of the Global Luxury Goods Fund (USLUX), the only luxury-focused mutual fund in North America. For the 12-month period through September 30, USLUX beat its benchmark, the S&P Composite 1500, after fees, by more than 750 basis points, on impressive revenue generated by many of the fund’s top holdings. Those include recognizable super luxury names such as Christian Dior; Hermes; Burberry; Ferrari; and LVMH, which posted a record 28.7 billion euros ($34.0 billion USD) in revenue in the first half of 2021.
“USLUX became available in July 2020 after we changed its name and investment strategy, and since then, it’s done better than even I imagined. After plunging due to the global health crisis, the personal luxury goods market returned to pre-pandemic growth in 2021, with sales estimated to top 283 billion euros ($325 billion USD) by year-end, according to a recent report by Bain & Company. That would represent a slight increase from then-record sales of 281 billion euros ($318 billion) in 2019.”
SEA to Set Sail in January
The Company is excited to announce that, after some unexpected delays, the U.S. Global Sea-to-Sky Cargo ETF (SEA) is set to launch in January 2022. SEA will seek to provide diversified access to the global sea shipping and air freight industries. Consisting of common stocks listed on developed and emerging market exchanges across the globe, the ETF will use a smart-beta strategy to determine the most efficient sea shipping and air freight companies in the world.
“After years of boom-and-bust cycles, container shipping companies today appear to have benefited greatly from favorable pricing power,” Mr. Holmes says. “At the same time that global demand has rocketed back to pre-pandemic levels much sooner than anticipated, shipping companies have exercised capacity growth restraint, as too many vessels and routes could oversaturate the market. Consequently, shipping rates have remained elevated near record highs.”
An Exciting Quarter for HIVE Blockchain Technologies
The Company’s principal exposure to the burgeoning crypto-mining industry remains HIVE Blockchain Technologies Ltd. (“HIVE”), which mines Bitcoin and Ether in facilities in Iceland, Sweden and Canada. Investments in HIVE, including warrants and convertible debentures, were valued at $23.2 million as of September 30, 2021.
“HIVE’s September quarter was highly eventful, right on the heels of its long-awaited Nasdaq listing in June,” comments Mr. Holmes. “HIVE added three brilliant new members to our leadership team: Aydin Kilic in the role of President and Chief Operating Officer; Johanna Thornblad, Sweden Country President; and Diana Biggs, member of the HIVE Switzerland Board of Directors. In September HIVE mined its 1,000th Bitcoin, an incredibly exciting milestone. Construction at our campus in New Brunswick, Canada, is in full throttle, the expansion of which will enable HIVE to deploy an additional 20 megawatts (MW) of green and clean Bitcoin mining capacity, with an additional 20MW scheduled to come online within the first quarter of calendar 2022.”
HIVE had a record-breaking quarter for the period ended September 30, 2021. Revenue rose to $52.6 million, up 41% compared to the previous quarter, and 305% compared to the same quarter last year. Net income was $59.8 million, an increase of 342% from last quarter, and 549% since the prior year. HIVE ended the September quarter holding 1,116 Bitcoin worth $48.4 Million and 25,154 Ether worth $74.7 Million.
Adequate Liquidity and Capital Resources
As of September 30, 2021, the Company had net working capital of approximately $26.7 million, an increase of $5.1 million, or 23.5% since June 30, 2021. With approximately $19.8 million in cash and cash equivalents, an increase of $5.3 million, or 36.8%, since the previous quarter, and $7.6 million in securities recorded at fair value, excluding convertible securities and warrants, the Company has adequate liquidity to meet its current obligations.
Share Repurchase Program
The Company has a share repurchase program, approved by the Board of Directors, authorizing it to annually purchase up to $2.75 million of its outstanding common shares on the open market through December 31, 2022. The repurchase program has been in place since December 2012. For the three months ended September 30, 2021, the Company repurchased 13,647 class A shares using cash of $82,000.
GROW Dividends
The Company’s Board of Directors has authorized a monthly dividend of $0.0075 per share through March 2022, at which time it will be considered for continuation by the Board. The total amount of cash dividends expected to be paid to class A and class C shareholders from October to March 2022 is approximately $676,000. Payment of cash dividends is within the discretion of the Board and is dependent on earnings, operations, capital requirements, the Company’s general financial condition of the Company and general business conditions.
Earnings Webcast Information
The Company has scheduled a webcast for 7:30 a.m. Central time on Wednesday, January 12, 2022, to discuss the Company’s key financial results for the year. Frank Holmes will be accompanied on the webcast by Lisa Callicotte, chief financial officer, and Holly Schoenfeldt, marketing and public relations manager. Click here to register for the earnings webcast or visit www.usfunds.com for more information.
Selected Financial Data (unaudited): (dollars in thousands, except per share data)
Three months ended | ||
9/30/2021 | 9/30/2020 | |
Operating Revenues | $6,521 | $3,245 |
Operating Expenses | 3,654 | 2,308 |
Operating Income | 2,867 | 937 |
Total Other Income | 37 | 1,037 |
Income Before Income Taxes | 2,904 | 1,974 |
Income Tax Expense | 514 | 30 |
Net Income | $2,390 | $1,944 |
Net income per share (basic and diluted) | $0.16 | $0.13 |
Avg. common shares outstanding (basic) | 15,030,115 | 15,080,549 |
Avg. common shares outstanding (diluted) | 15,031,199 | 15,080,743 |
Avg. assets under management from continuing operations (billions) | $4.0 | $2.0 |
####
About U.S. Global Investors, Inc.
The story of U.S. Global Investors goes back more than 50 years when it began as an investment club. Today, U.S. Global Investors, Inc. (www.usfunds.com) is a registered investment adviser that focuses on niche markets around the world. Headquartered in San Antonio, Texas, the Company provides money management and other services to U.S. Global Investors Funds and U.S. Global ETFs.
Forward-Looking Statements and Disclosure
This news release and other statements by U.S. Global Investors may include certain “forward-looking statements,” including statements relating to revenues, expenses and expectations regarding market conditions. You can identify these forward-looking statements by the use of words such as “outlook,” “believes,” “expects,” “potential,” “opportunity,” “seeks,” “anticipates” or other comparable words. Such statements involve certain risks and uncertainties and should be read with corporate filings and other important information on the Company’s website, www.usfunds.com, or the Securities and Exchange Commission’s website at www.sec.gov.
These filings, such as the Company’s annual report and Form 10-Q, should be read in conjunction with the other cautionary statements that are included in this release. Future events could differ materially from those anticipated in such statements and there can be no assurance that such statements will prove accurate and actual results may vary. The Company undertakes no obligation to publicly update or review any forward-looking statements, whether as a result of new information, future developments or otherwise.
Please consider carefully a fund’s investment objectives, risks, charges and expenses. For this and other important information, obtain a fund prospectus by visiting www.usfunds.com. Read it carefully before investing. U.S. Global mutual funds are distributed by Foreside Fund Services, LLC, Distributor. U.S. Global Investors is the investment adviser.
Total Annualized Returns as of 9/30/2021:
Fund | One-Year | Five-Year | Ten-Year | Gross Expense Ratio |
Global Luxury Goods Fund | 38.91% | 12.59% | 10.56% | 1.58% |
S&P Composite 1500 Index | 31.38% | 16.55% | 16.49% | n/a |
Performance data quoted above is historical. Past performance is no guarantee of future results. Results reflect the reinvestment of dividends and other earnings. For a portion of periods, the fund had expense limitations, without which returns would have been lower. Current performance may be higher or lower than the performance data quoted. The principal value and investment return of an investment will fluctuate so that your shares, when redeemed, may be worth more or less than their original cost. Performance does not include the effect of any direct fees described in the fund’s prospectus which, if applicable, would lower your total returns. Performance quoted for periods of one year or less is cumulative and not annualized. Obtain performance data current to the most recent month-end at www.usfunds.com or 1-800-US-FUNDS.
Foreside Fund Services, LLC, Distributor. U.S. Global Investors is the investment adviser. JETS and GOAU are distributed by Quasar Distributors, LLC. U.S. Global Investors is the investment adviser to JETS and GOAU. Foreside Fund Services, LLC and Quasar Distributors, LLC are affiliated.
Shares of any ETF are bought and sold at market price (not NAV), may trade at a discount or premium to NAV and are not individually redeemed from the funds. Brokerage commissions will reduce returns. Stock markets can be volatile and share prices can fluctuate in response to sector-related and other risks as described in the fund prospectus. Foreign and emerging market investing involves special risks such as currency fluctuation and less public disclosure, as well as economic and political risk. Companies in the consumer discretionary sector are subject to risks associated with fluctuations in the performance of domestic and international economies, interest rate changes, increased competition and consumer confidence. Gold, precious metals, and precious minerals funds may be susceptible to adverse economic, political or regulatory developments due to concentrating in a single theme. The prices of gold, precious metals, and precious minerals are subject to substantial price fluctuations over short periods of time and may be affected by unpredicted international monetary and political policies. We suggest investing no more than 5% to 10% of your portfolio in these sectors. The outbreak of the COVID-19 pandemic and the resulting actions to control or slow the spread has had a significant detrimental effect on the global and domestic economies, financial markets and industries, including airlines. U.S. Global Investors continues to monitor the impact of COVID-19, but it is too early to determine the full impact this virus may have on commercial aviation. Should this emerging macro-economic risk continue for an extended period, there could be an adverse material financial impact to the U.S. Global Jets ETF.
All opinions expressed and data provided are subject to change without notice. Some of these opinions may not be appropriate to every investor.
A smart-beta ETF is a type of exchange-traded fund that uses a rules-based system for selecting investments to be included in the fund. A basis point is one hundredth of a percent or equivalently one percent of one percent or one ten thousandth. The S&P 500 Index is a stock market index tracking the performance of 500 large companies listed on stock exchanges in the United States. The S&P Composite 1500 combines three leading indices, the S&P 500, the S&P MidCap 400 and the S&P SmallCap 600, to cover approximately 90% of U.S. market capitalization. Mutual fund investing involves risk. Principal loss is possible. Companies in the consumer discretionary sector are subject to risks associated with fluctuations in the performance of domestic and international economies, interest rate changes, increased competition and consumer confidence. The performance of such companies may also be affected by factors relating to levels of disposable household income, reduced consumer spending, changing demographics and consumer tastes, among others. Cryptocurrency markets and related securities have been, and are expected to continue to be, volatile. There has been significant volatility in the market price of HIVE, which has materially impacted the value of the investments included on the balance sheet, unrealized gain recognized in investment income (loss), and unrealized gain recognized in other comprehensive income (loss). The investments did not represent ownership in HIVE as of September 30, 2021, or June 30, 2021. The securities are subject to Canadian securities regulations. Frank Holmes serves on the board as non-executive chairman of HIVE and held shares and options at September 30, 2021. Effective August 31, 2018, Mr. Holmes was named Interim Executive Chairman of HIVE while a search for a new CEO is undertaken.
Fund portfolios are actively managed, and holdings may change daily. Holdings are not recommendations to buy or sell a security and are reported as of the most recent quarter-end. Holdings in the Global Luxury Goods Fund, Gold and Precious Metals Fund and World Precious Minerals Fund as a percentage of net assets as of 9/30/2021: Christian Dior SE (4.82% in Global Luxury Goods Fund, 0.00% in Gold and Precious Metals Fund, 0.00% in World Precious Minerals Fund), Hermes International (4.75% in Global Luxury Goods Fund, 0.00% in Gold and Precious Metals Fund, 0.00% in World Precious Minerals Fund), Burberry Group PLC (1.47% in Global Luxury Goods Fund, 0.00% in Gold and Precious Metals Fund, 0.00% in World Precious Minerals Fund), Ferrari NV (0.96% in Global Luxury Goods Fund, 0.00% in Gold and Precious Metals Fund, 0.00% in World Precious Minerals Fund), LVMH Moët Hennessy Louis Vuitton (1.00% in Global Luxury Goods Fund, 0.00% in Gold and Precious Metals Fund, 0.00% in World Precious Minerals Fund).
Attachments
CONTACT: Holly Schoenfeldt U.S. Global Investors, Inc. 210.308.1268 hschoenfeldt@usfunds.com

