
 Yahoo Finance
 U.S. Dollar Index Futures (DX) Technical Analysis – Ready to Soar When Euro Breaks Support
The U.S. Dollar fell against a basket of currencies on Wednesday as Treasury yields dropped and the Euro recovered from a one-week low. The British Pound also rebounded to move higher after hitting a multi-month low.
Treasury yields fell on Wednesday amid weaker-than-expected housing data. The Commerce Department said in a report that U.S. homebuilding fell for a second straight month in June and permits slumped to a two-year low, hinting at a softer housing market despite lower mortgage rates.
The Euro hit a one-week low against the dollar early in the session, weighed down by expectations of easing from the European Central Bank. The British Pound hit a 28-month low against the dollar on growing fears of a haphazard Brexit outcome at the end of October.
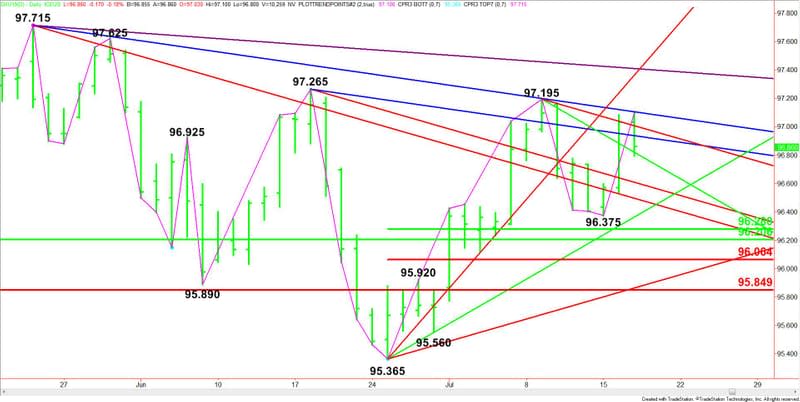
At 19:28 GMT, September U.S. Dollar Index futures are trading 96.855, down 0.175 or -0.18%.
Daily Technical Analysis
The main trend is down according to the daily swing chart. However, momentum has been trending higher since the formation of the closing price reversal bottom on June 25 at 95.365.
A trade through 97.195 will change the main trend to up. A move through 96.375 will signal a resumption of the downtrend, while shifting momentum to the downside.
The short-term range is 95.365 to 97.195. Its retracement zone at 96.280 to 96.065 is a potential downside target. The major retracement zone at 96.205 to 95.850 is controlling the longer-term direction of the index.
Daily Technical Forecast
Based on the current price at 96.855, the direction of the September U.S. Dollar Index into Wednesday’s close is likely to be determined by trader reaction to a downtrending Gann angle at 96.820.
Bearish Scenario
A sustained move under the downtrending Gann angle at 96.820 will indicate the presence of sellers. If this move creates enough downside momentum then look for the selling to possible extend into a pair of downtrending Gann angles at 96.610 and 96.500.
Bullish Scenario
A sustained move over 96.820 will signal the presence of buyers. This could lead to a labored rally with upside targets at 96.940 and 97.010.
Overview
That 97.195 to 97.265 area is proving to be solid resistance. It probably corresponds with the Euro at 1.1193 and 1.1181. If the Euro breaks through these levels then look for the U.S. Dollar Index to accelerate to the upside.
This article was originally posted on FX Empire
More From FXEMPIRE:
European Equities: Stats, FOMC Member Chatter and Trump in Focus
Crude Oil Price Forecast – Crude oil markets continue to struggle in general.
Forex Daily Recap – AUD/USD Aroused, Shrugging over Downbeat Part-time Data
Silver Price Forecast – Silver markets signal eminent pull back
Bitcoin Cash – ABC, Litecoin and Ripple Daily Analysis – 19/07/19
Major Cash, Futures Stock Indexes Turn Higher after Fed’s Williams’ Bullish Signal
