
 Yahoo Finance
 U.S. Dollar Index Futures (DX) Technical Analysis – June 20, 2019 Forecast
The U.S. Dollar is trading sharply lower against a basket of major currencies for a second session on Thursday. The move is being driven by the Fed. Most of the weakness is being fueled by a sharp rise in the Euro, which makes up about 57% of the U.S. Dollar Index.
At 14:16 GMT, September U.S. Dollar Index futures are trading 96.190, down 0.387 or -0.40%.
On Wednesday, the U.S. Federal Reserve kept its benchmark interest rate unchanged, but dropped enough hints in its monetary policy statement and Chairman Jerome Powell’s post-meeting press conference to drive financial futures traders into thinking there is a 100% chance of a rate cut when the Fed next meets on July 31.
The loss in the index is being driven by the Euro, which is up 0.66%, the British Pound, which is up 0.38%, the Canadian Dollar, which is up 0.68%, the Japanese Yen, which is up 0.42% and the Swiss Franc, which is up 1.14%.
Daily Swing Chart Technical Analysis
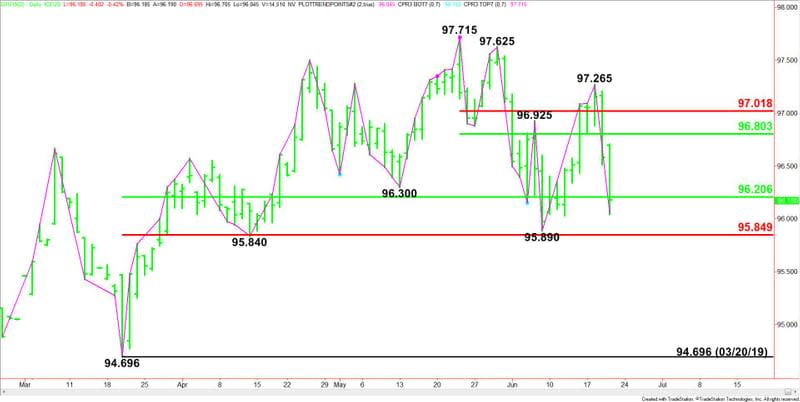
The main trend is up according to the daily swing chart, however, momentum shifted to the downside with the formation of a secondary lower top at 97.265 on June 18.
The main trend will change to down on a trade through 95.890. It will be reaffirmed on a move through 95.84. The daily chart is wide open to the downside under this level. A trade through 97.265 will signal a resumption of the uptrend.
The main range is 94.696 to 97.715. Its retracement zone at 96.205 to 95.850 is controlling the near-term direction of the index. It is acting like support today.
The short-term range is 97.715 to 95.890. Its retracement zone at 96.805 to 97.020 is resistance.
Daily Swing Chart Technical Forecast
Based on the early price action and the current price at 96.190, the direction of the September U.S. Dollar Index is likely to be determined by trader reaction to the main 50% level at 96.205.
Bullish Scenario
A sustained move over 96.205 will indicate the return of buyers. This could lead to a short-covering rally during the latter half of the session.
Bearish Scenario
A sustained move under 96.205 will signal the presence of sellers. If this move creates enough downside momentum then look for the selling to extend into the main bottom at 95.890, the main Fibonacci level at 95.850 and the main bottom at 95.840.
The main bottom at 95.840 is the trigger point for an acceleration to the downside with the next major target the March 20 main bottom at 94.700.
This article was originally posted on FX Empire
More From FXEMPIRE:
Crude Oil Weekly Price Forecast – Crude oil markets have bullish week
AUD/USD Weekly Price Forecast – Australian dollar shows signs of support
S&P 500 Weekly Price Forecast – Stock markets rally again for the week
Gold Price Forecast – Gold markets press major resistance barrier
Natural Gas Price Forecast – Natural gas markets drift lower
