
 Yahoo Finance
 U.S. Dollar Index Futures (DX) Technical Analysis – August 15, 2019 Forecast
The U.S. Dollar is edging lower against a basket of currencies on Thursday. The move is being primarily led by an uptick in the Euro after yesterday’s plunge. The British Pound is also catching a bid. The safe-haven Japanese Yen and Swiss Francs are trading slightly lower and the Canadian Dollar is firm against the greenback.
At 09:06 GMT, September U.S. Dollar Index futures are trading 97.810, down 0.016 or -0.02%.
There were no major economic reports out of the Euro Zone. In the U.K., Retail Sales came in at 0.2%, better than the -0.3% forecast. However, the previous month was revised lower to 0.9%.
Overnight, U.S. 30-year Treasury bonds fell below 2.0% for the first time, while the 2-year/10-year Treasury note spread hovered near an inversion. On Wednesday, these yields inverted, flashing a signal about the economy that many read to indicate a future recession.
Later today, the index is likely to be influenced by a slew of U.S. economic data including Retail Sales and the Philadelphia Fed Manufacturing Index.
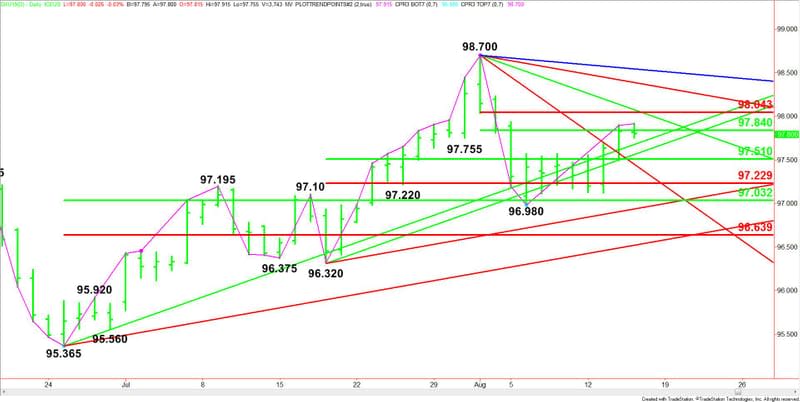
Daily Technical Analysis
The main trend is up according to the daily swing chart. A trade through 98.700 will reaffirm the uptrend. A move through 96.980 will change the main trend to down.
The main retracement zone support is 97.030 to 96.640. The intermediate retracement zone support is 97.510 to 97.230.
The short-term range is 98.700 to 96.980. Its retracement zone at 97.840 to 98.045 is currently being tested.
Daily Technical Forecast
Based on the early price action, the direction of the index the rest of the session is likely to be determined by trader reaction to the short-term 50% level at 97.840.
Bullish Scenario
A sustained move over 97.840 will indicate the presence of buyers. If this move creates enough upside momentum then look for the rally to possibly extend into the short-term Fibonacci level at 98.045, followed closely by the downtrending Gann angle at 98.075.
The angle at 98.075 is a possible trigger point for an acceleration into the next downtrending Gann angle at 98.390.
Bearish Scenario
A sustained move under 97.840 will signal the presence of sellers. The first downside target is a longer-term uptrending Gann angle at 97.680. The second is a short-term uptrending Gann angle at 97.570.
Crossing to the weak side of a downtrending Gann angle at 97.450 will put the September U.S. Dollar Index in a bearish position with 97.230 the next likely target.
This article was originally posted on FX Empire
