
 Yahoo Finance
 U.S. Dollar Index Futures (DX) Technical Analysis – June 25, 2019 Forecast
The U.S. Dollar Index is trading slightly lower early Tuesday, but in a limited range. The early pressure came from across the board strength in its components the: Euro, British Pound, Canadian Dollar, Swiss Franc and Japanese Yen.
As you can see, the Australian and New Zealand Dollars are not part of the index. All the component currencies were underpinned by expectations of a Fed cut in late July. We can’t say “rising expectations” anymore since the market has priced in a 100% chance of a rate cut. So if the chance of a rate cut falls below 100% then we’ll have a story.
Economic news tends to drive the Euro and British Pound. The Canadian Dollar is a commodity currency and the Swiss Franc and Japanese Yen are the safe-havens.
The Euro represents about 57% of the index. So when it strengthens, the dollar index tends to weaken. That brings us to today’s price action. After hitting a high at 1.1412 earlier in the session, the EUR/USD is now trading lower and could be forming a potentially bearish closing price reversal top. If the selling pressure continues then look for the dollar index to recover and possibly to higher for the session.
As far as the price action later in the day, Fed Chair Powell speaks at 17:00 GMT. He talking to a committee on foreign relations so he may not say anything about monetary policy. The currency markets will move if he talks about the criteria the central bank will use to determine whether to raise rates.
At 07:32 GMT, September U.S. Dollar Index futures are trading 95.430, down 0.057 or -0.05%.
Daily Technical Analysis
The main trend is down according to the daily swing chart. The market is in no position to change the main trend to up, but due to the steep five-day sell-off it may be ripe for a closing price reversal bottom. If the Euro posts a reversal top then look for the index to post a reversal bottom.
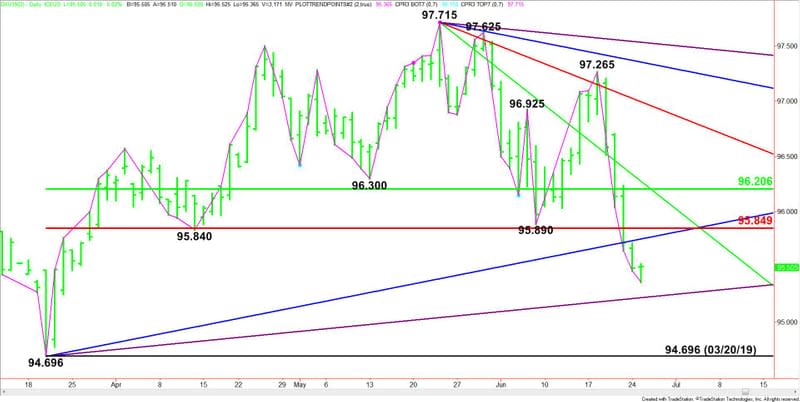
The main range is 94.696 to 97.715. Its retracement zone at 95.850 to 96.205 is controlling the longer-term direction of the index. The nearest resistance is the Fibonacci level at 95.850.
Daily Technical Forecast
Based on the early price action, the direction of the September U.S. Dollar Index on Tuesday is likely to be determined by trader reaction to Monday’s close at 95.487.
Bullish Scenario
A sustained move over 95.487 will indicate the buying is greater than the selling at current price levels. This will put the index in a position to form a closing price reversal bottom. If confirmed, this could lead to a 2 to 3 day counter-trend rally.
The first upside target today is an uptrending Gann angle at 95.760. Sellers could come in on the first test of this angle. Overcoming it will indicate the buying is getting stronger. This could trigger a further rally into the Fibonacci level at 95.850. Overtaking this level could shift short-term momentum to the upside.
Bearish Scenario
A sustained move under 95.487 will signal the presence of sellers. Taking out the intraday low at 95.365 could trigger a break into the next uptrending Gann angle at 95.230. This is the last potential support angle before the March 20 bottom at 94.696.
This article was originally posted on FX Empire
