
 Yahoo Finance
 What Type Of Shareholders Own The Most Number of Apollo Commercial Real Estate Finance, Inc. (NYSE:ARI) Shares?

If you want to know who really controls Apollo Commercial Real Estate Finance, Inc. (NYSE:ARI), then you'll have to look at the makeup of its share registry. Insiders often own a large chunk of younger, smaller, companies while huge companies tend to have institutions as shareholders. Companies that used to be publicly owned tend to have lower insider ownership.
Apollo Commercial Real Estate Finance has a market capitalization of US$1.3b, so we would expect some institutional investors to have noticed the stock. Taking a look at our data on the ownership groups (below), it's seems that institutions are noticeable on the share registry. Let's delve deeper into each type of owner, to discover more about Apollo Commercial Real Estate Finance.
Check out our latest analysis for Apollo Commercial Real Estate Finance
What Does The Institutional Ownership Tell Us About Apollo Commercial Real Estate Finance?
Many institutions measure their performance against an index that approximates the local market. So they usually pay more attention to companies that are included in major indices.
We can see that Apollo Commercial Real Estate Finance does have institutional investors; and they hold a good portion of the company's stock. This implies the analysts working for those institutions have looked at the stock and they like it. But just like anyone else, they could be wrong. If multiple institutions change their view on a stock at the same time, you could see the share price drop fast. It's therefore worth looking at Apollo Commercial Real Estate Finance's earnings history, below. Of course, the future is what really matters.

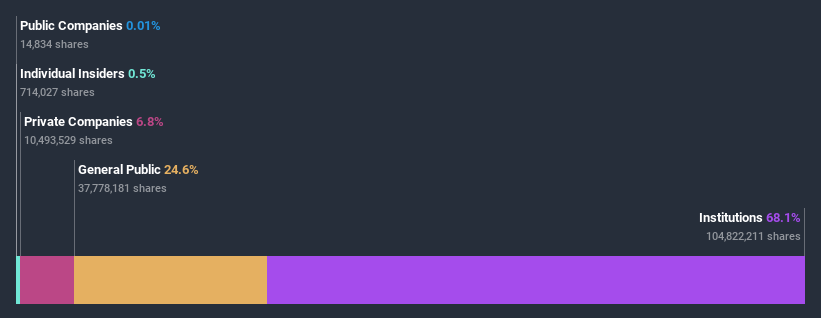
Investors should note that institutions actually own more than half the company, so they can collectively wield significant power. Apollo Commercial Real Estate Finance is not owned by hedge funds. The company's largest shareholder is BlackRock, Inc., with ownership of 17%. For context, the second largest shareholder holds about 11% of the shares outstanding, followed by an ownership of 6.8% by the third-largest shareholder.
We did some more digging and found that 9 of the top shareholders account for roughly 51% of the register, implying that along with larger shareholders, there are a few smaller shareholders, thereby balancing out each others interests somewhat.
While studying institutional ownership for a company can add value to your research, it is also a good practice to research analyst recommendations to get a deeper understand of a stock's expected performance. There are a reasonable number of analysts covering the stock, so it might be useful to find out their aggregate view on the future.
Insider Ownership Of Apollo Commercial Real Estate Finance
The definition of company insiders can be subjective, and does vary between jurisdictions. Our data reflects individual insiders, capturing board members at the very least. Management ultimately answers to the board. However, it is not uncommon for managers to be executive board members, especially if they are a founder or the CEO.
Insider ownership is positive when it signals leadership are thinking like the true owners of the company. However, high insider ownership can also give immense power to a small group within the company. This can be negative in some circumstances.
Our most recent data indicates that insiders own less than 1% of Apollo Commercial Real Estate Finance, Inc.. However, it's possible that insiders might have an indirect interest through a more complex structure. It is a pretty big company, so it would be possible for board members to own a meaningful interest in the company, without owning much of a proportional interest. In this case, they own around US$6.3m worth of shares (at current prices). It is always good to see at least some insider ownership, but it might be worth checking if those insiders have been selling.
General Public Ownership
The general public, with a 25% stake in the company, will not easily be ignored. This size of ownership, while considerable, may not be enough to change company policy if the decision is not in sync with other large shareholders.
Private Company Ownership
We can see that Private Companies own 6.8%, of the shares on issue. It might be worth looking deeper into this. If related parties, such as insiders, have an interest in one of these private companies, that should be disclosed in the annual report. Private companies may also have a strategic interest in the company.
Next Steps:
I find it very interesting to look at who exactly owns a company. But to truly gain insight, we need to consider other information, too. For example, we've discovered 5 warning signs for Apollo Commercial Real Estate Finance (2 make us uncomfortable!) that you should be aware of before investing here.
If you are like me, you may want to think about whether this company will grow or shrink. Luckily, you can check this free report showing analyst forecasts for its future.
NB: Figures in this article are calculated using data from the last twelve months, which refer to the 12-month period ending on the last date of the month the financial statement is dated. This may not be consistent with full year annual report figures.
This article by Simply Wall St is general in nature. It does not constitute a recommendation to buy or sell any stock, and does not take account of your objectives, or your financial situation. We aim to bring you long-term focused analysis driven by fundamental data. Note that our analysis may not factor in the latest price-sensitive company announcements or qualitative material. Simply Wall St has no position in any stocks mentioned.
Have feedback on this article? Concerned about the content? Get in touch with us directly. Alternatively, email editorial-team@simplywallst.com.
