
 Yahoo Finance
 What Type Of Shareholder Owns iLOOKABOUT Corp.'s (CVE:ILA)?

A look at the shareholders of iLOOKABOUT Corp. (CVE:ILA) can tell us which group is most powerful. Generally speaking, as a company grows, institutions will increase their ownership. Conversely, insiders often decrease their ownership over time. I quite like to see at least a little bit of insider ownership. As Charlie Munger said 'Show me the incentive and I will show you the outcome.'
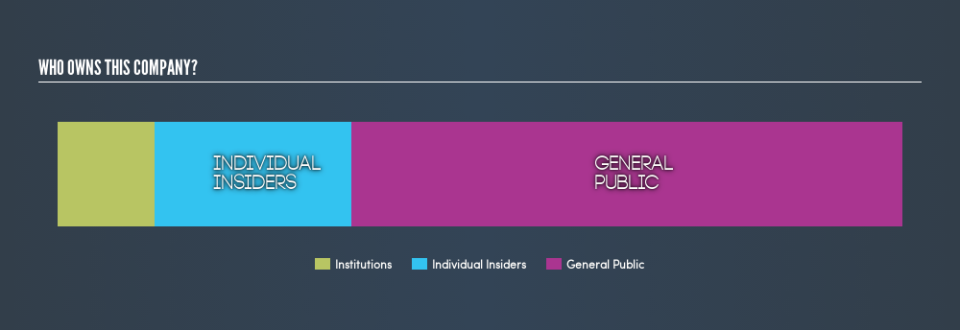
iLOOKABOUT is not a large company by global standards. It has a market capitalization of CA$21m, which means it wouldn't have the attention of many institutional investors. Taking a look at our data on the ownership groups (below), it's seems that institutional investors have bought into the company. We can zoom in on the different ownership groups, to learn more about ILA.
Check out our latest analysis for iLOOKABOUT
What Does The Institutional Ownership Tell Us About iLOOKABOUT?
Many institutions measure their performance against an index that approximates the local market. So they usually pay more attention to companies that are included in major indices.
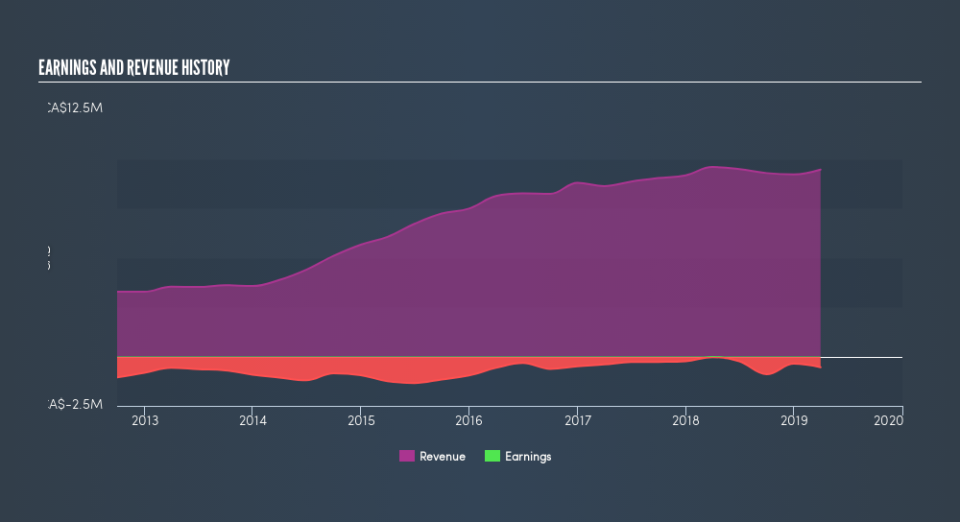
As you can see, institutional investors own 12% of iLOOKABOUT. This suggests some credibility amongst professional investors. But we can't rely on that fact alone, since institutions make bad investments sometimes, just like everyone does. If multiple institutions change their view on a stock at the same time, you could see the share price drop fast. It's therefore worth looking at iLOOKABOUT's earnings history, below. Of course, the future is what really matters.
We note that hedge funds don't have a meaningful investment in iLOOKABOUT. As far I can tell there isn't analyst coverage of the company, so it is probably flying under the radar.
Insider Ownership Of iLOOKABOUT
While the precise definition of an insider can be subjective, almost everyone considers board members to be insiders. Management ultimately answers to the board. However, it is not uncommon for managers to be executive board members, especially if they are a founder or the CEO.
I generally consider insider ownership to be a good thing. However, on some occasions it makes it more difficult for other shareholders to hold the board accountable for decisions.
Our information suggests that insiders maintain a significant holding in iLOOKABOUT Corp.. Insiders own CA$4.8m worth of shares in the CA$21m company. It is great to see insiders so invested in the business. It might be worth checking if those insiders have been buying recently.
General Public Ownership
The general public -- mostly retail investors -- own 65% of iLOOKABOUT . This level of ownership gives retail investors the power to sway key policy decisions such as board composition, executive compensation, and the dividend payout ratio.
Next Steps:
I find it very interesting to look at who exactly owns a company. But to truly gain insight, we need to consider other information, too.
I like to dive deeper into how a company has performed in the past. You can find historic revenue and earnings in this detailed graph.
If you would prefer check out another company -- one with potentially superior financials -- then do not miss this free list of interesting companies, backed by strong financial data.
NB: Figures in this article are calculated using data from the last twelve months, which refer to the 12-month period ending on the last date of the month the financial statement is dated. This may not be consistent with full year annual report figures.
We aim to bring you long-term focused research analysis driven by fundamental data. Note that our analysis may not factor in the latest price-sensitive company announcements or qualitative material.
If you spot an error that warrants correction, please contact the editor at editorial-team@simplywallst.com. This article by Simply Wall St is general in nature. It does not constitute a recommendation to buy or sell any stock, and does not take account of your objectives, or your financial situation. Simply Wall St has no position in the stocks mentioned. Thank you for reading.
