
 Yahoo Finance
 What Can We Make Of TUI AG’s (ETR:TUI1) High Return On Capital?

Today we'll look at TUI AG (ETR:TUI1) and reflect on its potential as an investment. Specifically, we'll consider its Return On Capital Employed (ROCE), since that will give us an insight into how efficiently the business can generate profits from the capital it requires.
First up, we'll look at what ROCE is and how we calculate it. Second, we'll look at its ROCE compared to similar companies. And finally, we'll look at how its current liabilities are impacting its ROCE.
Understanding Return On Capital Employed (ROCE)
ROCE is a measure of a company's yearly pre-tax profit (its return), relative to the capital employed in the business. All else being equal, a better business will have a higher ROCE. Overall, it is a valuable metric that has its flaws. Author Edwin Whiting says to be careful when comparing the ROCE of different businesses, since 'No two businesses are exactly alike.'
How Do You Calculate Return On Capital Employed?
Analysts use this formula to calculate return on capital employed:
Return on Capital Employed = Earnings Before Interest and Tax (EBIT) ÷ (Total Assets - Current Liabilities)
Or for TUI:
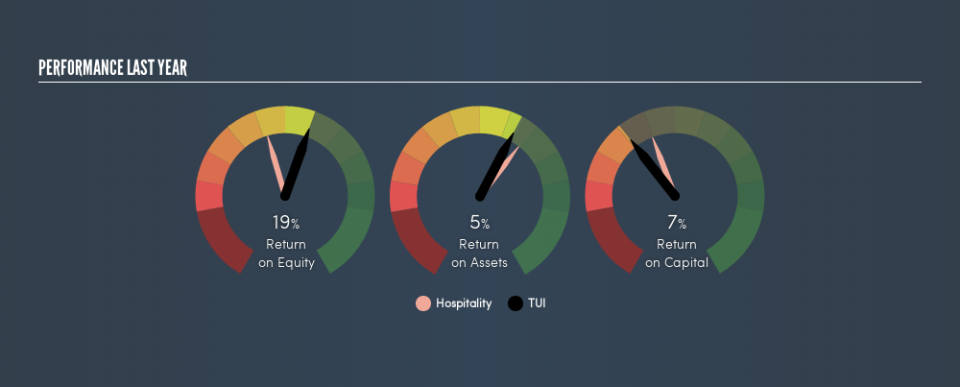
0.074 = €618m ÷ (€14b - €6.0b) (Based on the trailing twelve months to December 2018.)
Therefore, TUI has an ROCE of 7.4%.
View our latest analysis for TUI
Is TUI's ROCE Good?
ROCE can be useful when making comparisons, such as between similar companies. Using our data, we find that TUI's ROCE is meaningfully better than the 6.1% average in the Hospitality industry. We consider this a positive sign, because it suggests it uses capital more efficiently than similar companies. Aside from the industry comparison, TUI's ROCE is mediocre in absolute terms, considering the risk of investing in stocks versus the safety of a bank account. Investors may wish to consider higher-performing investments.
When considering ROCE, bear in mind that it reflects the past and does not necessarily predict the future. ROCE can be misleading for companies in cyclical industries, with returns looking impressive during the boom times, but very weak during the busts. ROCE is, after all, simply a snap shot of a single year. What happens in the future is pretty important for investors, so we have prepared a free report on analyst forecasts for TUI.
How TUI's Current Liabilities Impact Its ROCE
Liabilities, such as supplier bills and bank overdrafts, are referred to as current liabilities if they need to be paid within 12 months. Due to the way the ROCE equation works, having large bills due in the near term can make it look as though a company has less capital employed, and thus a higher ROCE than usual. To counteract this, we check if a company has high current liabilities, relative to its total assets.
TUI has total liabilities of €6.0b and total assets of €14b. Therefore its current liabilities are equivalent to approximately 42% of its total assets. TUI's middling level of current liabilities have the effect of boosting its ROCE a bit.
Our Take On TUI's ROCE
Unfortunately, its ROCE is still uninspiring, and there are potentially more attractive prospects out there. Of course, you might also be able to find a better stock than TUI. So you may wish to see this free collection of other companies that have grown earnings strongly.
If you like to buy stocks alongside management, then you might just love this free list of companies. (Hint: insiders have been buying them).
We aim to bring you long-term focused research analysis driven by fundamental data. Note that our analysis may not factor in the latest price-sensitive company announcements or qualitative material.
If you spot an error that warrants correction, please contact the editor at editorial-team@simplywallst.com. This article by Simply Wall St is general in nature. It does not constitute a recommendation to buy or sell any stock, and does not take account of your objectives, or your financial situation. Simply Wall St has no position in the stocks mentioned. Thank you for reading.
