
 Yahoo Finance
 TruFin's (LON:TRU) investors will be pleased with their impressive 115% return over the last three years
The most you can lose on any stock (assuming you don't use leverage) is 100% of your money. But if you buy shares in a really great company, you can more than double your money. To wit, the TruFin plc (LON:TRU) share price has flown 114% in the last three years. Most would be happy with that. It's also good to see the share price up 13% over the last quarter. But this could be related to the strong market, which is up 5.8% in the last three months.
So let's investigate and see if the longer term performance of the company has been in line with the underlying business' progress.
View our latest analysis for TruFin
TruFin isn't currently profitable, so most analysts would look to revenue growth to get an idea of how fast the underlying business is growing. Shareholders of unprofitable companies usually expect strong revenue growth. That's because it's hard to be confident a company will be sustainable if revenue growth is negligible, and it never makes a profit.
TruFin's revenue trended up 28% each year over three years. That's much better than most loss-making companies. Meanwhile, the share price performance has been pretty solid at 29% compound over three years. This suggests the market has recognized the progress the business has made, at least to a significant degree. Nonetheless, we'd say TruFin is still worth investigating - successful businesses can often keep growing for long periods.
The image below shows how earnings and revenue have tracked over time (if you click on the image you can see greater detail).
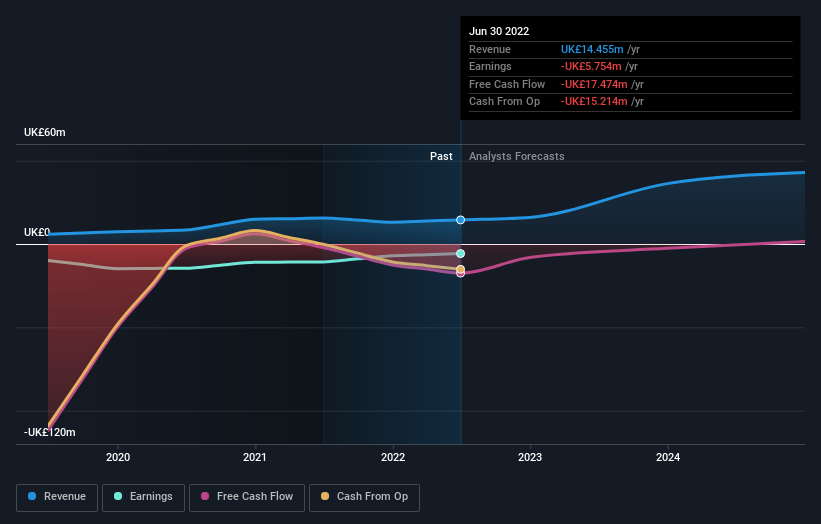
Take a more thorough look at TruFin's financial health with this free report on its balance sheet.
A Different Perspective
The last twelve months weren't great for TruFin shares, which performed worse than the market, costing holders 13%. Meanwhile, the broader market slid about 1.2%, likely weighing on the stock. Fortunately the longer term story is brighter, with total returns averaging about 29% per year over three years. Sometimes when a good quality long term winner has a weak period, it's turns out to be an opportunity, but you really need to be sure that the quality is there. It's always interesting to track share price performance over the longer term. But to understand TruFin better, we need to consider many other factors. Consider for instance, the ever-present spectre of investment risk. We've identified 4 warning signs with TruFin (at least 1 which is a bit concerning) , and understanding them should be part of your investment process.
But note: TruFin may not be the best stock to buy. So take a peek at this free list of interesting companies with past earnings growth (and further growth forecast).
Please note, the market returns quoted in this article reflect the market weighted average returns of stocks that currently trade on GB exchanges.
Have feedback on this article? Concerned about the content? Get in touch with us directly. Alternatively, email editorial-team (at) simplywallst.com.
This article by Simply Wall St is general in nature. We provide commentary based on historical data and analyst forecasts only using an unbiased methodology and our articles are not intended to be financial advice. It does not constitute a recommendation to buy or sell any stock, and does not take account of your objectives, or your financial situation. We aim to bring you long-term focused analysis driven by fundamental data. Note that our analysis may not factor in the latest price-sensitive company announcements or qualitative material. Simply Wall St has no position in any stocks mentioned.
Join A Paid User Research Session
You’ll receive a US$30 Amazon Gift card for 1 hour of your time while helping us build better investing tools for the individual investors like yourself. Sign up here
