
 Yahoo Finance
 Triumph Group, Inc. (NYSE:TGI) Is Expected To Breakeven In The Near Future
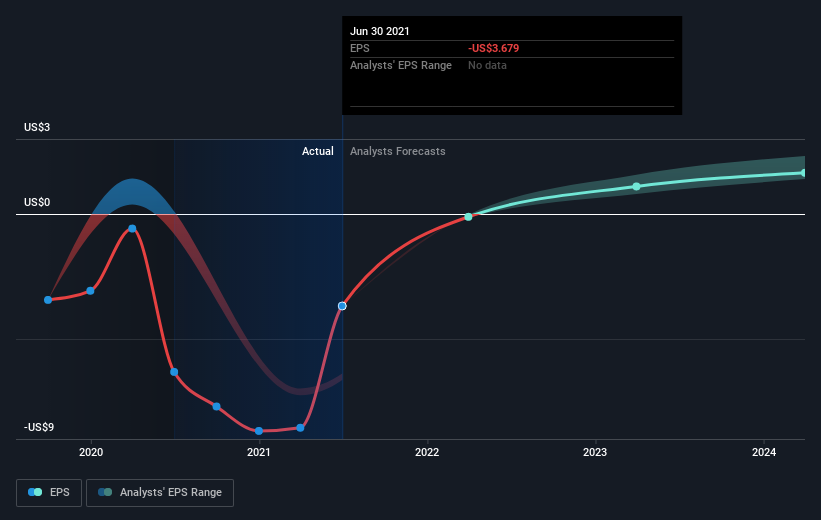
Triumph Group, Inc. (NYSE:TGI) is possibly approaching a major achievement in its business, so we would like to shine some light on the company. Triumph Group, Inc. designs, engineers, manufactures, repairs, overhauls, and distributes aerostructures, aircraft components, accessories, subassemblies, and systems worldwide. The US$1.3b market-cap company posted a loss in its most recent financial year of US$451m and a latest trailing-twelve-month loss of US$205m shrinking the gap between loss and breakeven. The most pressing concern for investors is Triumph Group's path to profitability – when will it breakeven? Below we will provide a high-level summary of the industry analysts’ expectations for the company.
Check out our latest analysis for Triumph Group
According to the 8 industry analysts covering Triumph Group, the consensus is that breakeven is near. They anticipate the company to incur a final loss in 2022, before generating positive profits of US$77m in 2023. The company is therefore projected to breakeven around 2 years from today. What rate will the company have to grow year-on-year in order to breakeven on this date? Using a line of best fit, we calculated an average annual growth rate of 84%, which is rather optimistic! If this rate turns out to be too aggressive, the company may become profitable much later than analysts predict.
Given this is a high-level overview, we won’t go into details of Triumph Group's upcoming projects, however, keep in mind that generally a high growth rate is not out of the ordinary, particularly when a company is in a period of investment.
Before we wrap up, there’s one issue worth mentioning. Triumph Group currently has negative equity on its balance sheet. This can sometimes arise from accounting methods used to deal with accumulated losses from prior years, which are viewed as liabilities carried forward until it cancels out in the future. Oftentimes, losses exist only on paper but other times, it can be a red flag.
Next Steps:
This article is not intended to be a comprehensive analysis on Triumph Group, so if you are interested in understanding the company at a deeper level, take a look at Triumph Group's company page on Simply Wall St. We've also put together a list of essential factors you should further research:
Valuation: What is Triumph Group worth today? Has the future growth potential already been factored into the price? The intrinsic value infographic in our free research report helps visualize whether Triumph Group is currently mispriced by the market.
Management Team: An experienced management team on the helm increases our confidence in the business – take a look at who sits on Triumph Group’s board and the CEO’s background.
Other High-Performing Stocks: Are there other stocks that provide better prospects with proven track records? Explore our free list of these great stocks here.
This article by Simply Wall St is general in nature. We provide commentary based on historical data and analyst forecasts only using an unbiased methodology and our articles are not intended to be financial advice. It does not constitute a recommendation to buy or sell any stock, and does not take account of your objectives, or your financial situation. We aim to bring you long-term focused analysis driven by fundamental data. Note that our analysis may not factor in the latest price-sensitive company announcements or qualitative material. Simply Wall St has no position in any stocks mentioned.
Have feedback on this article? Concerned about the content? Get in touch with us directly. Alternatively, email editorial-team (at) simplywallst.com.
