
 Yahoo Finance
 Triton International (NYSE:TRTN) Shareholders Will Want The ROCE Trajectory To Continue
If we want to find a potential multi-bagger, often there are underlying trends that can provide clues. One common approach is to try and find a company with returns on capital employed (ROCE) that are increasing, in conjunction with a growing amount of capital employed. Ultimately, this demonstrates that it's a business that is reinvesting profits at increasing rates of return. Speaking of which, we noticed some great changes in Triton International's (NYSE:TRTN) returns on capital, so let's have a look.
What Is Return On Capital Employed (ROCE)?
For those that aren't sure what ROCE is, it measures the amount of pre-tax profits a company can generate from the capital employed in its business. Analysts use this formula to calculate it for Triton International:
Return on Capital Employed = Earnings Before Interest and Tax (EBIT) ÷ (Total Assets - Current Liabilities)
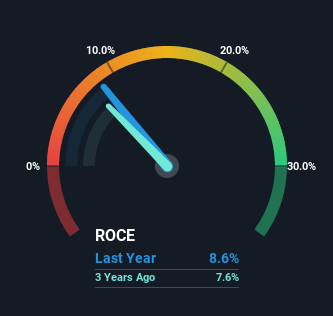
0.086 = US$1.1b ÷ (US$12b - US$108m) (Based on the trailing twelve months to September 2022).
So, Triton International has an ROCE of 8.6%. In absolute terms, that's a low return and it also under-performs the Trade Distributors industry average of 16%.
See our latest analysis for Triton International
Above you can see how the current ROCE for Triton International compares to its prior returns on capital, but there's only so much you can tell from the past. If you'd like to see what analysts are forecasting going forward, you should check out our free report for Triton International.
So How Is Triton International's ROCE Trending?
While in absolute terms it isn't a high ROCE, it's promising to see that it has been moving in the right direction. The numbers show that in the last five years, the returns generated on capital employed have grown considerably to 8.6%. The company is effectively making more money per dollar of capital used, and it's worth noting that the amount of capital has increased too, by 34%. This can indicate that there's plenty of opportunities to invest capital internally and at ever higher rates, a combination that's common among multi-baggers.
The Key Takeaway
A company that is growing its returns on capital and can consistently reinvest in itself is a highly sought after trait, and that's what Triton International has. And with the stock having performed exceptionally well over the last five years, these patterns are being accounted for by investors. Therefore, we think it would be worth your time to check if these trends are going to continue.
If you'd like to know more about Triton International, we've spotted 3 warning signs, and 1 of them is potentially serious.
While Triton International isn't earning the highest return, check out this free list of companies that are earning high returns on equity with solid balance sheets.
Have feedback on this article? Concerned about the content? Get in touch with us directly. Alternatively, email editorial-team (at) simplywallst.com.
This article by Simply Wall St is general in nature. We provide commentary based on historical data and analyst forecasts only using an unbiased methodology and our articles are not intended to be financial advice. It does not constitute a recommendation to buy or sell any stock, and does not take account of your objectives, or your financial situation. We aim to bring you long-term focused analysis driven by fundamental data. Note that our analysis may not factor in the latest price-sensitive company announcements or qualitative material. Simply Wall St has no position in any stocks mentioned.
Join A Paid User Research Session
You’ll receive a US$30 Amazon Gift card for 1 hour of your time while helping us build better investing tools for the individual investors like yourself. Sign up here
