
 Yahoo Finance
 TriplePoint (TPVG) Stock Falls on Q3 Earnings Miss, Costs Up
TriplePoint Venture Growth BDC Corp.’s TPVG shares lost 10.5% following the release of third-quarter 2019 results. Its net investment income per share of 29 cents lagged the Zacks Consensus Estimate of 42 cents. Also, the bottom line declined 37% from the year-ago quarter.
Results were hurt by a decline in total investment and other income along with rise in expenses. However, the company’s balance sheet position and portfolio activity remained strong in the quarter.
Net investment income of $7.1 million for the reported quarter was lower than the prior-year quarter’s figure of $10 million.
Total Investment Income Declines, Expenses Rise
Total investment and other income amounted to $15.7 million, down 11.2% year over year. The fall reflected a decrease in interest income from investments and other income. Also, the figure lagged the Zacks Consensus Estimate of $19.3 million.
Total operating expenses increased 11.9% year over year to $8.6 million. The increase reflected a rise in almost all expense components, except for income incentive fee.
Balance Sheet Strong
As of Sep 30, 2019, TriplePoint’s net asset value was $13.47 per share compared with $13.50 as of Dec 31, 2018.
The company had $189.8 million in liquidity, consisting of $60.6 million in cash and $129.2 million of available capacity under its revolving credit facilities, as of Sep 30, 2019.
As of Sep 30, 2019, total assets amounted to $591.1 million, up from $467.1 million as of Dec 31, 2018.
Total Portfolio Value & New Commitments
The fair value of TriplePoint’s total investment portfolio was $526 million as of Sep 30, 2019, up from $351.3 million as of Sep 30, 2018.
In the reported quarter, the company closed $81.2 million in new debt commitments and funded $84.7 million in debt investments.
Our Take
TriplePoint’s investment income is expected to improve, driven by the rise in demand for customized financing and improving economy, going forward. However, elevated expenses (witnessed in the reported quarter as well) may hurt the bottom line.
TriplePoint Venture Growth BDC Corp. Price, Consensus and EPS Surprise
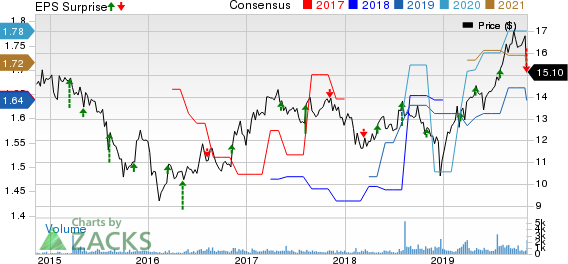
TriplePoint Venture Growth BDC Corp. price-consensus-eps-surprise-chart | TriplePoint Venture Growth BDC Corp. Quote
Currently, the company carries a Zacks Rank #4 (Sell).
You can see the complete list of today’s Zacks #1 Rank (Strong Buy) stocks here.
Performance & Earnings Release Date of Other Finance Stocks
Hercules Capital Inc’s HTGC third-quarter 2019 net investment income of 37 cents per share outpaced the Zacks Consensus Estimate of 34 cents. The bottom line was 19.4% above the year-ago figure.
Ares Capital Corporation’s ARCC third-quarter 2019 core earnings of 48 cents per share surpassed the Zacks Consensus Estimate of 46 cents. Also, the bottom line rose 6.7% from the year-ago quarter.
Garrison Capital Inc GARS is scheduled to report third-quarter results on Nov 12.
Today's Best Stocks from Zacks
Would you like to see the updated picks from our best market-beating strategies? From 2017 through 2018, while the S&P 500 gained +15.8%, five of our screens returned +38.0%, +61.3%, +61.6%, +68.1%, and +98.3%.
This outperformance has not just been a recent phenomenon. From 2000 – 2018, while the S&P averaged +4.8% per year, our top strategies averaged up to +56.2% per year.
See their latest picks free >>
Want the latest recommendations from Zacks Investment Research? Today, you can download 7 Best Stocks for the Next 30 Days. Click to get this free report
Garrison Capital Inc. (GARS) : Free Stock Analysis Report
TriplePoint Venture Growth BDC Corp. (TPVG) : Free Stock Analysis Report
Hercules Capital, Inc. (HTGC) : Free Stock Analysis Report
Ares Capital Corporation (ARCC) : Free Stock Analysis Report
To read this article on Zacks.com click here.
