
 Yahoo Finance
 Trinseo's (TSE) Stock Down 8% Since Earnings Miss in Q3
Trinseo PLC’s TSE stock is down around 8% since the company came up with its third-quarter 2021 results, wherein earnings missed the Zacks Consensus Estimate.
While the company faced headwinds from challenging industry operating conditions, including supply chain and energy constraints, it benefited from strong demand in all segments in the quarter.
Trinseo PLC Price, Consensus and EPS Surprise

Trinseo PLC price-consensus-eps-surprise-chart | Trinseo PLC Quote
Earnings and Revenues Discussion
Trinseo recorded a profit (from continuing operations) of $79 million or $2.01 per share in third-quarter 2021, up from a profit of $40 million or $1.04 a year ago.
Barring one-time items, earnings were $2.01 a share, missing the Zacks Consensus Estimate of $2.29.
Revenues climbed around 87% year over year to $1,269.3 million in the quarter. The top line was driven by higher prices as well as the addition of the acquired businesses within the Engineered Materials segment.
Segment Highlights
Revenues at the Latex Binders segment shot up 72% year over year to $316 million in the reported quarter due to the pass through of higher raw material costs and increased sales volumes.
Revenues at the Engineered Materials segment surged around 362% year over year to $231 million, aided by higher volumes and the addition of the acquired businesses.
Revenues at the Base Plastics unit went up 64% year over year to $393 million on the passthrough of higher raw materials as well as higher pricing.
Sales at the Polystyrene segment climbed 64% year over year to $275 million, partly due to the pass through of higher styrene costs.
Feedstocks segment sales rose 42% year over year to $55 million, resulting from the pass through of higher styrene costs.
The Americas Styrenics unit logged adjusted EBITDA of $17 million for the quarter, down around 5% year over year. The decline was because higher polystyrene demand was more than offset by production issues from Hurricane Ida and reduced styrene margins.
Financials
Trinseo ended the quarter with cash and cash equivalents of $207.5 million, down around 59% year over year. Long-term debt was $2,307.9 million, up around 99% year over year.
Cash from operations was $208 million for the reported quarter. Free cash flow was of $173 million for the quarter.
Outlook
For 2021, Trinseo sees net income from continuing operations in the range of $336-$376 million. Adjusted EBITDA is forecast in the band of $750-$800 million.
The company also expects cash from operations of $420-$445 million and free cash flow of $300-$325 million for full-year 2021.
Trinseo also announced the planned divestiture of its styrenics businesses. It intends to launch a formal sales process in the first quarter of 2022.
Price Performance
Trinseo’s shares have surged 46.8% over a year, outperforming the industry's decline of 15.5%.
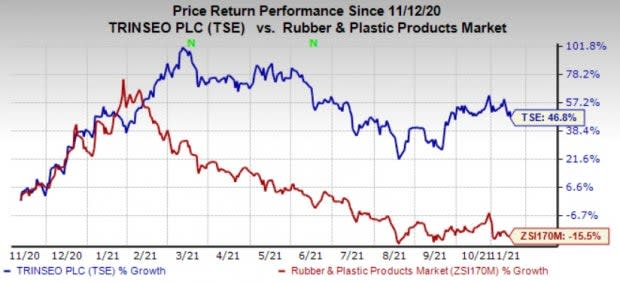
Image Source: Zacks Investment Research
Zacks Rank & Key Picks
Trinseo currently carries a Zacks Rank #2 (Buy).
Other top-ranked stocks worth considering in the basic materials space include Nutrien Ltd. NTR, Steel Dynamics, Inc. STLD and Dow Inc. DOW, each sporting a Zacks Rank #1 (Strong Buy). You can see the complete list of today’s Zacks #1 Rank stocks here.
Nutrien has an expected earnings growth rate of 212.2% for the current year. The Zacks Consensus Estimate for earnings for the current year for the company has been revised 13.5% upward over the last 60 days.
Nutrien beat the Zacks Consensus Estimate for earnings in three of the last four quarters while missed once. NTR has a trailing four-quarter earnings surprise of roughly 73.5%, on average. Its shares have also rallied around 64% over a year.
Steel Dynamics has a projected an earnings growth rate of 477.5% for the current year. The consensus estimate for the current year has been revised 15.5% upward over the last 60 days.
Steel Dynamics beat the Zacks Consensus Estimate for earnings in each of the trailing four quarters, the average being 5.1%. STLD shares have surged around 95% in a year.
Dow has a projected earnings growth rate of 447% for the current year. The consensus estimate for the current year has been revised 8.7% upward over the last 60 days.
Dow beat the Zacks Consensus Estimate for earnings in each of the trailing four quarters, the average being 14.1%. DOW shares have gained around 15% in a year.
Want the latest recommendations from Zacks Investment Research? Today, you can download 7 Best Stocks for the Next 30 Days. Click to get this free report
Steel Dynamics, Inc. (STLD) : Free Stock Analysis Report
Dow Inc. (DOW) : Free Stock Analysis Report
Trinseo PLC (TSE) : Free Stock Analysis Report
Nutrien Ltd. (NTR) : Free Stock Analysis Report
To read this article on Zacks.com click here.
Zacks Investment Research
