
 Yahoo Finance
 Was TRI Pointe Group Inc’s (NYSE:TPH) Earnings Growth Better Than The Industry’s?

When TRI Pointe Group Inc (NYSE:TPH) released its most recent earnings update (31 March 2018), I compared it against two factor: its historical earnings track record, and the performance of its industry peers on average. Understanding how TRI Pointe Group performed requires a benchmark rather than trying to assess a standalone number at one point in time. Below is a quick commentary on how I see TPH has performed. Check out our latest analysis for TRI Pointe Group
Were TPH’s earnings stronger than its past performances and the industry?
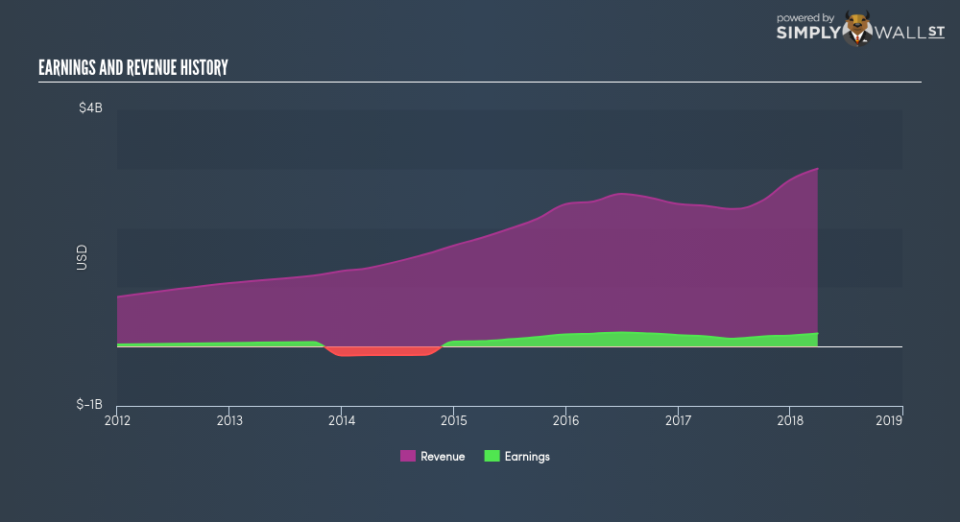
TPH’s trailing twelve-month earnings (from 31 March 2018) of US$221.88m has jumped 26.92% compared to the previous year. However, this one-year growth rate has been lower than its average earnings growth rate over the past 5 years of 31.31%, indicating the rate at which TPH is growing has slowed down. Why could this be happening? Well, let’s take a look at what’s transpiring with margins and whether the rest of the industry is facing the same headwind.
Over the past few years, revenue growth has fallen behind which suggests that TRI Pointe Group’s bottom line has been propelled by unsustainable cost-cutting. Looking at growth from a sector-level, the US consumer durables industry has been growing its average earnings by double-digit 10.84% in the prior year, and 16.31% over the past five. This means that any tailwind the industry is deriving benefit from, TRI Pointe Group is able to leverage this to its advantage.
In terms of returns from investment, TRI Pointe Group has not invested its equity funds well, leading to a 11.31% return on equity (ROE), below the sensible minimum of 20%. Furthermore, its return on assets (ROA) of 5.77% is below the US Consumer Durables industry of 6.31%, indicating TRI Pointe Group’s are utilized less efficiently. However, its return on capital (ROC), which also accounts for TRI Pointe Group’s debt level, has increased over the past 3 years from 5.98% to 10.82%. This correlates with a decrease in debt holding, with debt-to-equity ratio declining from 84.95% to 74.99% over the past 5 years.
What does this mean?
Though TRI Pointe Group’s past data is helpful, it is only one aspect of my investment thesis. While TRI Pointe Group has a good historical track record with positive growth and profitability, there’s no certainty that this will extrapolate into the future. I recommend you continue to research TRI Pointe Group to get a better picture of the stock by looking at:
Future Outlook: What are well-informed industry analysts predicting for TPH’s future growth? Take a look at our free research report of analyst consensus for TPH’s outlook.
Financial Health: Is TPH’s operations financially sustainable? Balance sheets can be hard to analyze, which is why we’ve done it for you. Check out our financial health checks here.
Other High-Performing Stocks: Are there other stocks that provide better prospects with proven track records? Explore our free list of these great stocks here.
NB: Figures in this article are calculated using data from the trailing twelve months from 31 March 2018. This may not be consistent with full year annual report figures.
To help readers see pass the short term volatility of the financial market, we aim to bring you a long-term focused research analysis purely driven by fundamental data. Note that our analysis does not factor in the latest price sensitive company announcements.
The author is an independent contributor and at the time of publication had no position in the stocks mentioned.
