
 Yahoo Finance
 What Can The Trends At Parex Resources (TSE:PXT) Tell Us About Their Returns?
If we want to find a stock that could multiply over the long term, what are the underlying trends we should look for? In a perfect world, we'd like to see a company investing more capital into its business and ideally the returns earned from that capital are also increasing. If you see this, it typically means it's a company with a great business model and plenty of profitable reinvestment opportunities. Speaking of which, we noticed some great changes in Parex Resources' (TSE:PXT) returns on capital, so let's have a look.
Understanding Return On Capital Employed (ROCE)
Just to clarify if you're unsure, ROCE is a metric for evaluating how much pre-tax income (in percentage terms) a company earns on the capital invested in its business. The formula for this calculation on Parex Resources is:
Return on Capital Employed = Earnings Before Interest and Tax (EBIT) ÷ (Total Assets - Current Liabilities)
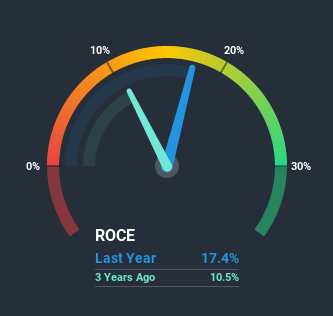
0.17 = US$252m ÷ (US$1.5b - US$101m) (Based on the trailing twelve months to September 2020).
Thus, Parex Resources has an ROCE of 17%. On its own, that's a standard return, however it's much better than the 6.6% generated by the Oil and Gas industry.
Check out our latest analysis for Parex Resources
Above you can see how the current ROCE for Parex Resources compares to its prior returns on capital, but there's only so much you can tell from the past. If you'd like to see what analysts are forecasting going forward, you should check out our free report for Parex Resources.
The Trend Of ROCE
We're delighted to see that Parex Resources is reaping rewards from its investments and is now generating some pre-tax profits. About five years ago the company was generating losses but things have turned around because it's now earning 17% on its capital. In addition to that, Parex Resources is employing 68% more capital than previously which is expected of a company that's trying to break into profitability. We like this trend, because it tells us the company has profitable reinvestment opportunities available to it, and if it continues going forward that can lead to a multi-bagger performance.
What We Can Learn From Parex Resources' ROCE
In summary, it's great to see that Parex Resources has managed to break into profitability and is continuing to reinvest in its business. And with the stock having performed exceptionally well over the last five years, these patterns are being accounted for by investors. So given the stock has proven it has promising trends, it's worth researching the company further to see if these trends are likely to persist.
On a final note, we've found 2 warning signs for Parex Resources that we think you should be aware of.
While Parex Resources isn't earning the highest return, check out this free list of companies that are earning high returns on equity with solid balance sheets.
This article by Simply Wall St is general in nature. It does not constitute a recommendation to buy or sell any stock, and does not take account of your objectives, or your financial situation. We aim to bring you long-term focused analysis driven by fundamental data. Note that our analysis may not factor in the latest price-sensitive company announcements or qualitative material. Simply Wall St has no position in any stocks mentioned.
Have feedback on this article? Concerned about the content? Get in touch with us directly. Alternatively, email editorial-team (at) simplywallst.com.
