
 Yahoo Finance
 TransUnion (NYSE:TRU) stock falls 6.0% in past week as one-year earnings and shareholder returns continue downward trend
The simplest way to benefit from a rising market is to buy an index fund. But if you buy individual stocks, you can do both better or worse than that. Investors in TransUnion (NYSE:TRU) have tasted that bitter downside in the last year, as the share price dropped 23%. That's well below the market decline of 0.3%. Longer term shareholders haven't suffered as badly, since the stock is down a comparatively less painful 18% in three years.
Since TransUnion has shed US$796m from its value in the past 7 days, let's see if the longer term decline has been driven by the business' economics.
View our latest analysis for TransUnion
To paraphrase Benjamin Graham: Over the short term the market is a voting machine, but over the long term it's a weighing machine. One way to examine how market sentiment has changed over time is to look at the interaction between a company's share price and its earnings per share (EPS).
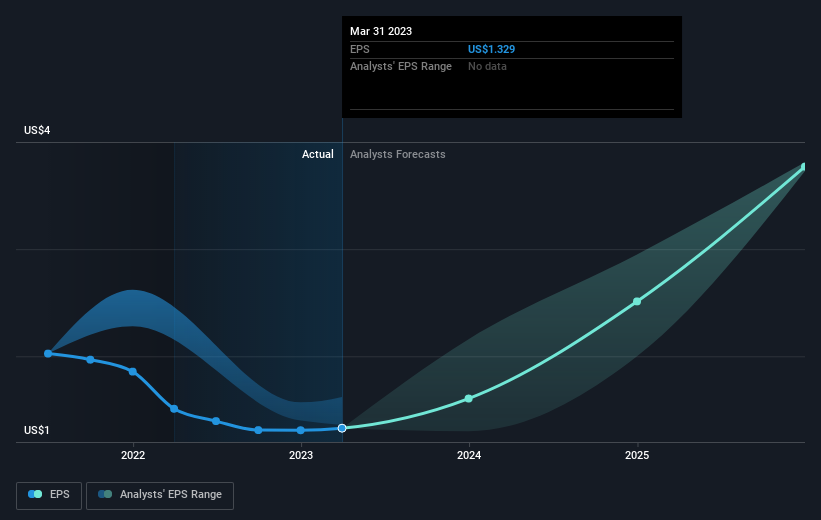
Unfortunately TransUnion reported an EPS drop of 12% for the last year. This reduction in EPS is not as bad as the 23% share price fall. So it seems the market was too confident about the business, a year ago.
You can see how EPS has changed over time in the image below (click on the chart to see the exact values).
We like that insiders have been buying shares in the last twelve months. Even so, future earnings will be far more important to whether current shareholders make money. Dive deeper into the earnings by checking this interactive graph of TransUnion's earnings, revenue and cash flow.
A Different Perspective
TransUnion shareholders are down 23% for the year (even including dividends), but the market itself is up 0.3%. However, keep in mind that even the best stocks will sometimes underperform the market over a twelve month period. Unfortunately, last year's performance may indicate unresolved challenges, given that it was worse than the annualised loss of 1.0% over the last half decade. We realise that Baron Rothschild has said investors should "buy when there is blood on the streets", but we caution that investors should first be sure they are buying a high quality business. While it is well worth considering the different impacts that market conditions can have on the share price, there are other factors that are even more important. Even so, be aware that TransUnion is showing 2 warning signs in our investment analysis , and 1 of those is a bit concerning...
If you like to buy stocks alongside management, then you might just love this free list of companies. (Hint: insiders have been buying them).
Please note, the market returns quoted in this article reflect the market weighted average returns of stocks that currently trade on American exchanges.
Have feedback on this article? Concerned about the content? Get in touch with us directly. Alternatively, email editorial-team (at) simplywallst.com.
This article by Simply Wall St is general in nature. We provide commentary based on historical data and analyst forecasts only using an unbiased methodology and our articles are not intended to be financial advice. It does not constitute a recommendation to buy or sell any stock, and does not take account of your objectives, or your financial situation. We aim to bring you long-term focused analysis driven by fundamental data. Note that our analysis may not factor in the latest price-sensitive company announcements or qualitative material. Simply Wall St has no position in any stocks mentioned.
Join A Paid User Research Session
You’ll receive a US$30 Amazon Gift card for 1 hour of your time while helping us build better investing tools for the individual investors like yourself. Sign up here
