This Trading Model Says It's Time To Buy Goldman Sachs

It may be a good time to buy Goldman Sachs Group, Inc. (NYSE: GS) stock.
What To Know: Many successful traders use trading models to make their buy and sell decisions. The models are based on quantitative parameters. This means the signals they give aren't based on emotions, and trading based on emotion is why most traders aren’t successful.
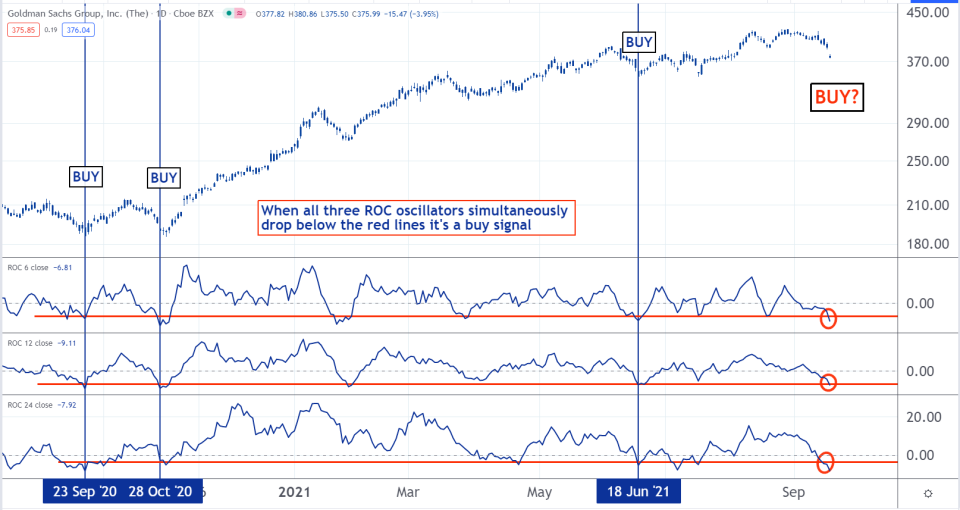
The following chart is based on a model developed by Martin Pring, a famous and well-respected technical analyst.
Why It's Important: There are three oscillators on the bottom half of the chart. They measure the percentage change in the stock over six-, 12-, and 24-day periods.
When all three are simultaneously below their respective red horizontal lines, it’s a buy signal. That’s the case now.
The last three times the model gave accurate buy signals, and it may be doing so again.
To learn more about building trading models, join the new Benzina Trading School.

See more from Benzinga
© 2021 Benzinga.com. Benzinga does not provide investment advice. All rights reserved.

 Yahoo Finance