
 Yahoo Finance
 The total return for Haynes International (NASDAQ:HAYN) investors has risen faster than earnings growth over the last three years
The Haynes International, Inc. (NASDAQ:HAYN) share price has had a bad week, falling 13%. But that doesn't undermine the rather lovely longer-term return, if you measure over the last three years. Indeed, the share price is up a very strong 143% in that time. So the recent fall in the share price should be viewed in that context. The fundamental business performance will ultimately dictate whether the top is in, or if this is a stellar buying opportunity.
Since the long term performance has been good but there's been a recent pullback of 13%, let's check if the fundamentals match the share price.
View our latest analysis for Haynes International
While markets are a powerful pricing mechanism, share prices reflect investor sentiment, not just underlying business performance. One flawed but reasonable way to assess how sentiment around a company has changed is to compare the earnings per share (EPS) with the share price.
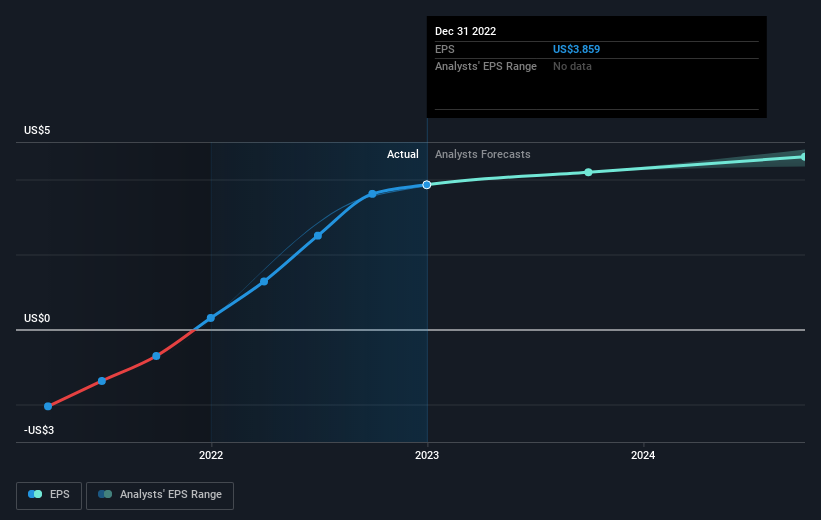
During three years of share price growth, Haynes International achieved compound earnings per share growth of 48% per year. This EPS growth is higher than the 34% average annual increase in the share price. So it seems investors have become more cautious about the company, over time.
The company's earnings per share (over time) is depicted in the image below (click to see the exact numbers).
We know that Haynes International has improved its bottom line over the last three years, but what does the future have in store? Take a more thorough look at Haynes International's financial health with this free report on its balance sheet.
What About Dividends?
When looking at investment returns, it is important to consider the difference between total shareholder return (TSR) and share price return. The TSR is a return calculation that accounts for the value of cash dividends (assuming that any dividend received was reinvested) and the calculated value of any discounted capital raisings and spin-offs. Arguably, the TSR gives a more comprehensive picture of the return generated by a stock. As it happens, Haynes International's TSR for the last 3 years was 164%, which exceeds the share price return mentioned earlier. This is largely a result of its dividend payments!
A Different Perspective
It's nice to see that Haynes International shareholders have received a total shareholder return of 25% over the last year. And that does include the dividend. That's better than the annualised return of 6% over half a decade, implying that the company is doing better recently. In the best case scenario, this may hint at some real business momentum, implying that now could be a great time to delve deeper. I find it very interesting to look at share price over the long term as a proxy for business performance. But to truly gain insight, we need to consider other information, too. For instance, we've identified 2 warning signs for Haynes International (1 is concerning) that you should be aware of.
Of course, you might find a fantastic investment by looking elsewhere. So take a peek at this free list of companies we expect will grow earnings.
Please note, the market returns quoted in this article reflect the market weighted average returns of stocks that currently trade on US exchanges.
Have feedback on this article? Concerned about the content? Get in touch with us directly. Alternatively, email editorial-team (at) simplywallst.com.
This article by Simply Wall St is general in nature. We provide commentary based on historical data and analyst forecasts only using an unbiased methodology and our articles are not intended to be financial advice. It does not constitute a recommendation to buy or sell any stock, and does not take account of your objectives, or your financial situation. We aim to bring you long-term focused analysis driven by fundamental data. Note that our analysis may not factor in the latest price-sensitive company announcements or qualitative material. Simply Wall St has no position in any stocks mentioned.
Join A Paid User Research Session
You’ll receive a US$30 Amazon Gift card for 1 hour of your time while helping us build better investing tools for the individual investors like yourself. Sign up here
