
 Yahoo Finance
 The TJX Companies' (TJX) Q2 Earnings Top Estimates, Sales Down
The TJX Companies, Inc. TJX reported second-quarter fiscal 2023 results, with the bottom line beating the Zacks Consensus Estimate. The top line declined and missed the consensus mark. The company’s U.S. comp sales were dented by escalated inflation, which affected consumer discretionary spending.
The company raised its fiscal 2023 pretax profit margin. However, the company lowered its full-year adjusted earnings and U.S. comp store sales guidance range.
The TJX Companies, Inc. Price, Consensus and EPS Surprise

The TJX Companies, Inc. price-consensus-eps-surprise-chart | The TJX Companies, Inc. Quote
Q2 in Details
TJX Companies’ second-quarter earnings came in at 69 cents per share. In second-quarter fiscal 2022, the company’s earnings came in at 64 cents per share, which included a debt extinguishment charge of 15 cents per share. The bottom line surpassed the Zacks Consensus Estimate of 67 cents per share.
Net sales came in at $11,843 million, down 2% from $12,077 million reported in the year-ago quarter.The metric missed the Zacks Consensus Estimate of $11,958.9 million. In the Marmaxx (U.S.) division, the company’s net sales came in at $7,235 million, down from $7,349 million reported in the year-ago quarter. The metric stood at $1,856 million, down from $2,083 million across the HomeGoods (U.S.) division. TJX Canada’s net sales came in at $1,248, higher than the $1,022 reported in the year-ago quarter. TJX International’s (Europe & Australia) net sales were $1,503 million, down from $1,623 million posted in the year-ago quarter.
Total U.S. comparable-store sales declined 5% in the second quarter of fiscal 2023, compared with a 21% increase in U.S. open-only comp store sales in the second quarter of fiscal 2022. Comp-store sales fell 2% in Marmaxx. Comp-store sales fell 13% in the HomeGoods category.
The pretax profit margin came in at 9.2%, up from 8.7% reported in the year-ago quarter. However, the metric was down 1.5 percentage points compared with the year-ago quarter’s adjusted pretax profit margin of 10.7%. The merchandise margin gained on the solid markon and pricing initiative but was hurt by incremental freight pressure. Incremental wage costs adversely affected the pretax profit margin by 0.8 percentage points.
The gross profit margin was 27.6%, down 1.8 percentage points. Selling, general and administrative (SG&A) costs as a percent of sales came in at 18.4%, flat year over year.
Other Updates
TJX Companies’ ended the quarter with cash and cash equivalents of $3,531.2 million, long-term debt of $2,857.1 million and shareholders’ equity of $5,396.6 million. For 26 weeks ended Jul 30, 2022, the company’s net cash provided by operating activities stood at $6.2 million.
During the quarter, management returned more than $1 billion to shareholders. The company repurchased $700 million in stock, retiring 11.8 million shares. The company paid $346 million in shareholder dividends. Management expects to buyback $2.25 to $2.50 billion of the company’s stock in fiscal 2023.
As of Jul 30, 2022, total inventories were $7.1 billion. Management is optimistic about its capabilities to provide impressive selections and values to its stores and online during the fall and holiday selling season.
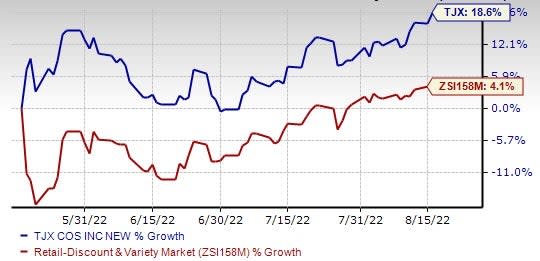
Image Source: Zacks Investment Research
Outlook
Management is raising its fiscal 2023 pretax profit margin. The company now expects a fiscal 2023 pretax profit margin of 9.3-9.5% and an adjusted pretax profit margin of 9.7-9.9%. Earlier, management had projected pretax profit margin to be in the 9.2-9.4% range and adjusted pretax profit margin of 9.6-9.8%.
For fiscal 2023, management envisions adjusted EPS in the range of $3.05 to 3.13, below the earlier guidance range of $3.13 to $3.20. The company now expects U.S. comparable store sales to decline 2-3% in fiscal 2023. Earlier, management had envisioned the metric to increase between 1% and 2%.
For the third quarter of fiscal 2023, management anticipates a pretax profit margin in the range of 10.1-10.4% and earnings per share (EPS) between 77 and 81 cents. For the quarter, the company is projecting a U.S. comparable store sales decline of 3-5%. The company reported 16% U.S. open-only comp store sales growth in the third quarter of fiscal 2022.
Shares of the Zacks Rank #3 (Hold) company have increased 18.6% in the past three months compared with the industry’s 4.1% growth.
Retail Stocks to Consider
Some better-ranked stocks are Dollar General DG, Dollar Tree DLTR and Costco COST.
Dollar General, a discount retailer, currently carries a Zacks Rank #2 (Buy). DG has an expected earnings per share growth rate of 12.8% for three to five years. You can see the complete list of today’s Zacks #1 Rank (Strong Buy) stocks here.
The Zacks Consensus Estimate for Dollar General’s current financial-year revenues and EPS suggests growth of 10% and 13.4%, respectively, from the year-ago reported figure. Dollar General has a trailing four-quarter earnings surprise of 2.8%, on average.
Dollar Tree operates a discount variety retail stores. The stock currently carries a Zacks Rank #2. DLTR has expected earnings per share growth rate of 15.5% for three to five years.
The Zacks Consensus Estimate for Dollar Tree’s current financial-year revenues and EPS suggests growth of 6.7% and 40.7%, respectively, from the year-ago reported figure. DLTR has a trailing four-quarter earnings surprise of 13.1%, on average.
Costco, which is engaged in the operation of membership warehouses, carries a Zacks Rank #2. COST has an expected earnings per share growth rate of 9.2% for three to five years.
The Zacks Consensus Estimate for Costco’s current financial-year sales and EPS suggests growth of 15.4% and 18.2%, respectively, from the year-ago period. COST has a trailing four-quarter earnings surprise of 9.7%, on average.
Want the latest recommendations from Zacks Investment Research? Today, you can download 7 Best Stocks for the Next 30 Days. Click to get this free report
The TJX Companies, Inc. (TJX) : Free Stock Analysis Report
Dollar General Corporation (DG) : Free Stock Analysis Report
Dollar Tree, Inc. (DLTR) : Free Stock Analysis Report
Costco Wholesale Corporation (COST) : Free Stock Analysis Report
To read this article on Zacks.com click here.
Zacks Investment Research
