
 Yahoo Finance
 Those Who Purchased New West Energy Services (CVE:NWE) Shares Five Years Ago Have A 96% Loss To Show For It

Long term investing works well, but it doesn't always work for each individual stock. We really hate to see fellow investors lose their hard-earned money. Imagine if you held New West Energy Services Inc. (CVE:NWE) for half a decade as the share price tanked 96%. And some of the more recent buyers are probably worried, too, with the stock falling 79% in the last year. Furthermore, it's down 40% in about a quarter. That's not much fun for holders.
We really hope anyone holding through that price crash has a diversified portfolio. Even when you lose money, you don't have to lose the lesson.
Check out our latest analysis for New West Energy Services
Given that New West Energy Services didn't make a profit in the last twelve months, we'll focus on revenue growth to form a quick view of its business development. Shareholders of unprofitable companies usually expect strong revenue growth. As you can imagine, fast revenue growth, when maintained, often leads to fast profit growth.
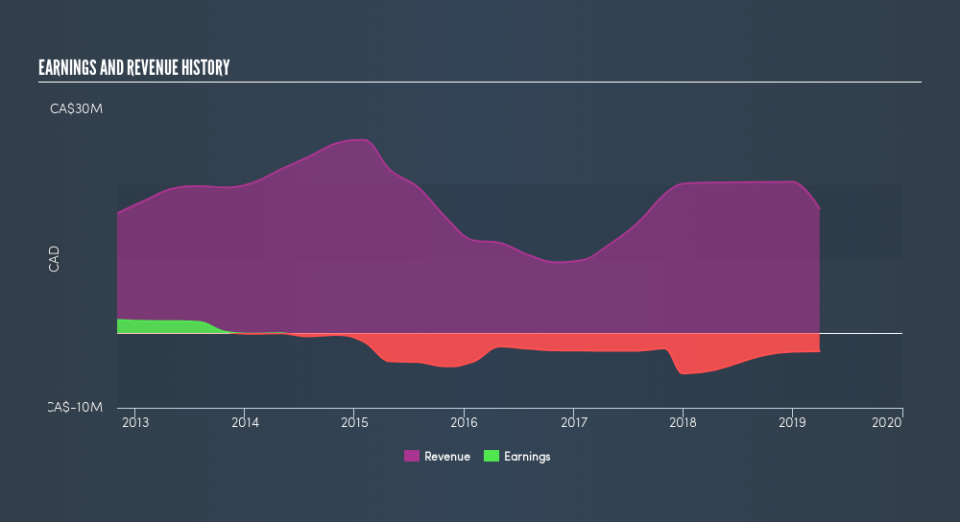
In the last five years New West Energy Services saw its revenue shrink by 8.7% per year. That's definitely a weaker result than most pre-profit companies report. So it's not that strange that the share price dropped 47% per year in that period. This kind of price performance makes us very wary, especially when combined with falling revenue. Of course, the poor performance could mean the market has been too severe selling down. That can happen.
The image below shows how earnings and revenue have tracked over time (if you click on the image you can see greater detail).
Take a more thorough look at New West Energy Services's financial health with this free report on its balance sheet.
A Different Perspective
We regret to report that New West Energy Services shareholders are down 79% for the year. Unfortunately, that's worse than the broader market decline of 1.5%. However, it could simply be that the share price has been impacted by broader market jitters. It might be worth keeping an eye on the fundamentals, in case there's a good opportunity. Regrettably, last year's performance caps off a bad run, with the shareholders facing a total loss of 47% per year over five years. Generally speaking long term share price weakness can be a bad sign, though contrarian investors might want to research the stock in hope of a turnaround. Most investors take the time to check the data on insider transactions. You can click here to see if insiders have been buying or selling.
If you are like me, then you will not want to miss this free list of growing companies that insiders are buying.
Please note, the market returns quoted in this article reflect the market weighted average returns of stocks that currently trade on CA exchanges.
We aim to bring you long-term focused research analysis driven by fundamental data. Note that our analysis may not factor in the latest price-sensitive company announcements or qualitative material.
If you spot an error that warrants correction, please contact the editor at editorial-team@simplywallst.com. This article by Simply Wall St is general in nature. It does not constitute a recommendation to buy or sell any stock, and does not take account of your objectives, or your financial situation. Simply Wall St has no position in the stocks mentioned. Thank you for reading.
