
 Yahoo Finance
 Those Who Purchased RPT Realty (NYSE:RPT) Shares Three Years Ago Have A 34% Loss To Show For It

Want to participate in a research study? Help shape the future of investing tools and earn a $60 gift card!
Many investors define successful investing as beating the market average over the long term. But its virtually certain that sometimes you will buy stocks that fall short of the market average returns. We regret to report that long term RPT Realty (NYSE:RPT) shareholders have had that experience, with the share price dropping 34% in three years, versus a market return of about 46%. It's up 3.9% in the last seven days.
Check out our latest analysis for RPT Realty
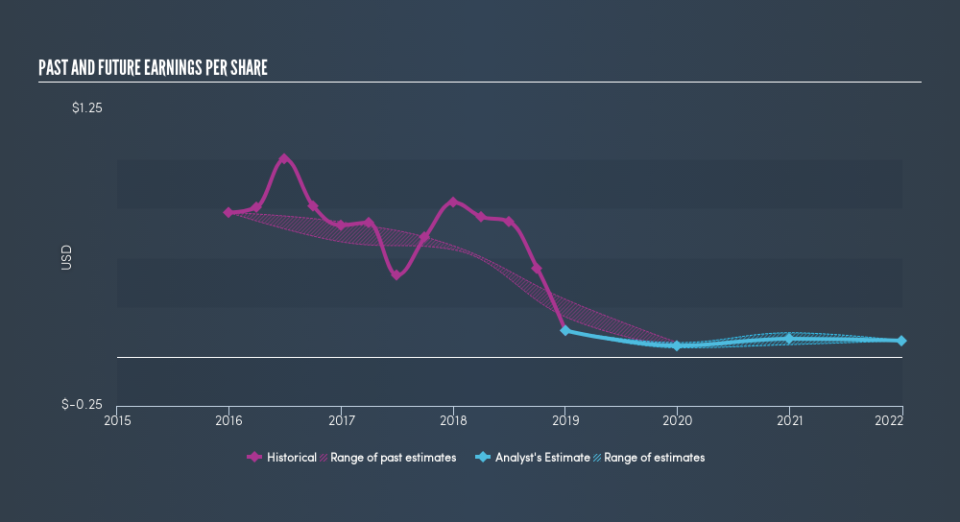
There is no denying that markets are sometimes efficient, but prices do not always reflect underlying business performance. One way to examine how market sentiment has changed over time is to look at the interaction between a company's share price and its earnings per share (EPS).
During the three years that the share price fell, RPT Realty's earnings per share (EPS) dropped by 43% each year. In comparison the 13% compound annual share price decline isn't as bad as the EPS drop-off. This suggests that the market retains some optimism around long term earnings stability, despite past EPS declines. This positive sentiment is also reflected in the generous P/E ratio of 91.40.
The graphic below depicts how EPS has changed over time (unveil the exact values by clicking on the image).
It's good to see that there was some significant insider buying in the last three months. That's a positive. On the other hand, we think the revenue and earnings trends are much more meaningful measures of the business. This free interactive report on RPT Realty's earnings, revenue and cash flow is a great place to start, if you want to investigate the stock further.
What About Dividends?
As well as measuring the share price return, investors should also consider the total shareholder return (TSR). Whereas the share price return only reflects the change in the share price, the TSR includes the value of dividends (assuming they were reinvested) and the benefit of any discounted capital raising or spin-off. Arguably, the TSR gives a more comprehensive picture of the return generated by a stock. In the case of RPT Realty, it has a TSR of -20% for the last 3 years. That exceeds its share price return that we previously mentioned. This is largely a result of its dividend payments!
A Different Perspective
RPT Realty shareholders are up 4.2% for the year (even including dividends). But that return falls short of the market. But at least that's still a gain! Over five years the TSR has been a reduction of 0.4% per year, over five years. So this might be a sign the business has turned its fortunes around. It is all well and good that insiders have been buying shares, but we suggest you check here to see what price insiders were buying at.
RPT Realty is not the only stock that insiders are buying. For those who like to find winning investments this free list of growing companies with recent insider purchasing, could be just the ticket.
Please note, the market returns quoted in this article reflect the market weighted average returns of stocks that currently trade on US exchanges.
We aim to bring you long-term focused research analysis driven by fundamental data. Note that our analysis may not factor in the latest price-sensitive company announcements or qualitative material.
If you spot an error that warrants correction, please contact the editor at editorial-team@simplywallst.com. This article by Simply Wall St is general in nature. It does not constitute a recommendation to buy or sell any stock, and does not take account of your objectives, or your financial situation. Simply Wall St has no position in the stocks mentioned. Thank you for reading.
