
 Yahoo Finance
 Those Who Purchased Boyuan Construction Group (TSE:BOY) Shares Five Years Ago Have A 42% Loss To Show For It

While it may not be enough for some shareholders, we think it is good to see the Boyuan Construction Group, Inc. (TSE:BOY) share price up 23% in a single quarter. But that doesn't change the fact that the returns over the last five years have been less than pleasing. In fact, the share price is down 42%, which falls well short of the return you could get by buying an index fund.
See our latest analysis for Boyuan Construction Group
In his essay The Superinvestors of Graham-and-Doddsville Warren Buffett described how share prices do not always rationally reflect the value of a business. One flawed but reasonable way to assess how sentiment around a company has changed is to compare the earnings per share (EPS) with the share price.
During the unfortunate half decade during which the share price slipped, Boyuan Construction Group actually saw its earnings per share (EPS) improve by 24% per year. Given the share price reaction, one might suspect that EPS is not a good guide to the business performance during the period (perhaps due to a one-off loss or gain). Alternatively, growth expectations may have been unreasonable in the past.
Due to the lack of correlation between the EPS growth and the falling share price, it's worth taking a look at other metrics to try to understand the share price movement.
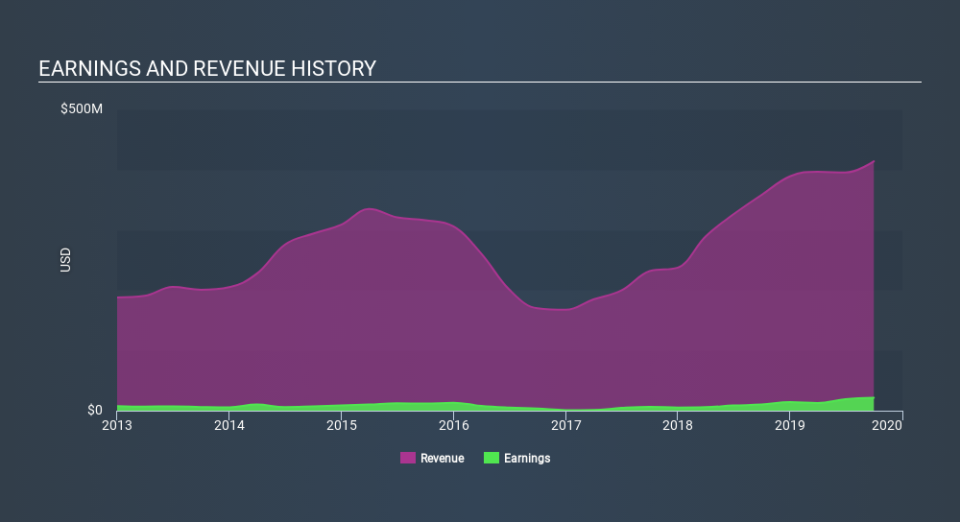
Revenue is actually up 6.6% over the time period. A more detailed examination of the revenue and earnings may or may not explain why the share price languishes; there could be an opportunity.
You can see how earnings and revenue have changed over time in the image below (click on the chart to see the exact values).
We're pleased to report that the CEO is remunerated more modestly than most CEOs at similarly capitalized companies. It's always worth keeping an eye on CEO pay, but a more important question is whether the company will grow earnings throughout the years. This free interactive report on Boyuan Construction Group's earnings, revenue and cash flow is a great place to start, if you want to investigate the stock further.
A Different Perspective
It's nice to see that Boyuan Construction Group shareholders have received a total shareholder return of 25% over the last year. Notably the five-year annualised TSR loss of 10% per year compares very unfavourably with the recent share price performance. The long term loss makes us cautious, but the short term TSR gain certainly hints at a brighter future. Shareholders might want to examine this detailed historical graph of past earnings, revenue and cash flow.
Of course, you might find a fantastic investment by looking elsewhere. So take a peek at this free list of companies we expect will grow earnings.
Please note, the market returns quoted in this article reflect the market weighted average returns of stocks that currently trade on CA exchanges.
If you spot an error that warrants correction, please contact the editor at editorial-team@simplywallst.com. This article by Simply Wall St is general in nature. It does not constitute a recommendation to buy or sell any stock, and does not take account of your objectives, or your financial situation. Simply Wall St has no position in the stocks mentioned.
We aim to bring you long-term focused research analysis driven by fundamental data. Note that our analysis may not factor in the latest price-sensitive company announcements or qualitative material. Thank you for reading.
