
 Yahoo Finance
 We Think M.D.C. Holdings (NYSE:MDC) Might Have The DNA Of A Multi-Bagger
To find a multi-bagger stock, what are the underlying trends we should look for in a business? Firstly, we'd want to identify a growing return on capital employed (ROCE) and then alongside that, an ever-increasing base of capital employed. Ultimately, this demonstrates that it's a business that is reinvesting profits at increasing rates of return. And in light of that, the trends we're seeing at M.D.C. Holdings' (NYSE:MDC) look very promising so lets take a look.
What is Return On Capital Employed (ROCE)?
If you haven't worked with ROCE before, it measures the 'return' (pre-tax profit) a company generates from capital employed in its business. To calculate this metric for M.D.C. Holdings, this is the formula:
Return on Capital Employed = Earnings Before Interest and Tax (EBIT) ÷ (Total Assets - Current Liabilities)
0.20 = US$836m ÷ (US$5.1b - US$827m) (Based on the trailing twelve months to March 2022).
So, M.D.C. Holdings has an ROCE of 20%. That's a fantastic return and not only that, it outpaces the average of 16% earned by companies in a similar industry.
See our latest analysis for M.D.C. Holdings
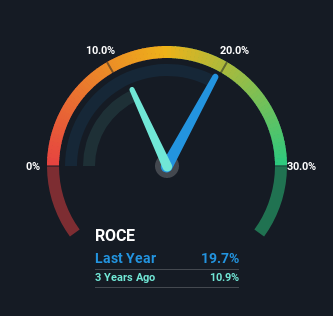
Above you can see how the current ROCE for M.D.C. Holdings compares to its prior returns on capital, but there's only so much you can tell from the past. If you're interested, you can view the analysts predictions in our free report on analyst forecasts for the company.
What The Trend Of ROCE Can Tell Us
Investors would be pleased with what's happening at M.D.C. Holdings. The data shows that returns on capital have increased substantially over the last five years to 20%. Basically the business is earning more per dollar of capital invested and in addition to that, 93% more capital is being employed now too. The increasing returns on a growing amount of capital is common amongst multi-baggers and that's why we're impressed.
The Key Takeaway
All in all, it's terrific to see that M.D.C. Holdings is reaping the rewards from prior investments and is growing its capital base. And investors seem to expect more of this going forward, since the stock has rewarded shareholders with a 61% return over the last five years. In light of that, we think it's worth looking further into this stock because if M.D.C. Holdings can keep these trends up, it could have a bright future ahead.
M.D.C. Holdings does come with some risks though, we found 3 warning signs in our investment analysis, and 1 of those can't be ignored...
If you'd like to see other companies earning high returns, check out our free list of companies earning high returns with solid balance sheets here.
Have feedback on this article? Concerned about the content? Get in touch with us directly. Alternatively, email editorial-team (at) simplywallst.com.
This article by Simply Wall St is general in nature. We provide commentary based on historical data and analyst forecasts only using an unbiased methodology and our articles are not intended to be financial advice. It does not constitute a recommendation to buy or sell any stock, and does not take account of your objectives, or your financial situation. We aim to bring you long-term focused analysis driven by fundamental data. Note that our analysis may not factor in the latest price-sensitive company announcements or qualitative material. Simply Wall St has no position in any stocks mentioned.
