
 Yahoo Finance
 We Think CTS (NYSE:CTS) Can Manage Its Debt With Ease
Legendary fund manager Li Lu (who Charlie Munger backed) once said, 'The biggest investment risk is not the volatility of prices, but whether you will suffer a permanent loss of capital.' When we think about how risky a company is, we always like to look at its use of debt, since debt overload can lead to ruin. We note that CTS Corporation (NYSE:CTS) does have debt on its balance sheet. But is this debt a concern to shareholders?
What Risk Does Debt Bring?
Debt is a tool to help businesses grow, but if a business is incapable of paying off its lenders, then it exists at their mercy. If things get really bad, the lenders can take control of the business. However, a more frequent (but still costly) occurrence is where a company must issue shares at bargain-basement prices, permanently diluting shareholders, just to shore up its balance sheet. Of course, plenty of companies use debt to fund growth, without any negative consequences. The first step when considering a company's debt levels is to consider its cash and debt together.
View our latest analysis for CTS
What Is CTS's Debt?
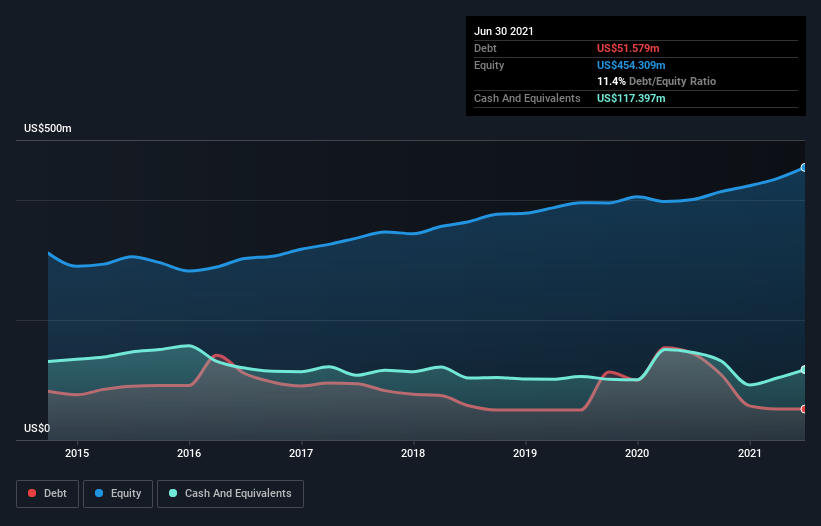
The image below, which you can click on for greater detail, shows that CTS had debt of US$51.6m at the end of June 2021, a reduction from US$143.9m over a year. But on the other hand it also has US$117.4m in cash, leading to a US$65.8m net cash position.
A Look At CTS' Liabilities
We can see from the most recent balance sheet that CTS had liabilities of US$102.3m falling due within a year, and liabilities of US$90.7m due beyond that. On the other hand, it had cash of US$117.4m and US$80.8m worth of receivables due within a year. So it actually has US$5.20m more liquid assets than total liabilities.
This state of affairs indicates that CTS' balance sheet looks quite solid, as its total liabilities are just about equal to its liquid assets. So while it's hard to imagine that the US$1.13b company is struggling for cash, we still think it's worth monitoring its balance sheet. Simply put, the fact that CTS has more cash than debt is arguably a good indication that it can manage its debt safely.
And we also note warmly that CTS grew its EBIT by 17% last year, making its debt load easier to handle. The balance sheet is clearly the area to focus on when you are analysing debt. But ultimately the future profitability of the business will decide if CTS can strengthen its balance sheet over time. So if you're focused on the future you can check out this free report showing analyst profit forecasts.
Finally, a business needs free cash flow to pay off debt; accounting profits just don't cut it. While CTS has net cash on its balance sheet, it's still worth taking a look at its ability to convert earnings before interest and tax (EBIT) to free cash flow, to help us understand how quickly it is building (or eroding) that cash balance. Over the last three years, CTS recorded free cash flow worth a fulsome 100% of its EBIT, which is stronger than we'd usually expect. That puts it in a very strong position to pay down debt.
Summing up
While it is always sensible to investigate a company's debt, in this case CTS has US$65.8m in net cash and a decent-looking balance sheet. The cherry on top was that in converted 100% of that EBIT to free cash flow, bringing in US$80m. So we don't think CTS's use of debt is risky. Over time, share prices tend to follow earnings per share, so if you're interested in CTS, you may well want to click here to check an interactive graph of its earnings per share history.
If, after all that, you're more interested in a fast growing company with a rock-solid balance sheet, then check out our list of net cash growth stocks without delay.
This article by Simply Wall St is general in nature. We provide commentary based on historical data and analyst forecasts only using an unbiased methodology and our articles are not intended to be financial advice. It does not constitute a recommendation to buy or sell any stock, and does not take account of your objectives, or your financial situation. We aim to bring you long-term focused analysis driven by fundamental data. Note that our analysis may not factor in the latest price-sensitive company announcements or qualitative material. Simply Wall St has no position in any stocks mentioned.
Have feedback on this article? Concerned about the content? Get in touch with us directly. Alternatively, email editorial-team (at) simplywallst.com.
