
 Yahoo Finance
 There's Reason For Concern Over Varonis Systems, Inc.'s (NASDAQ:VRNS) Price
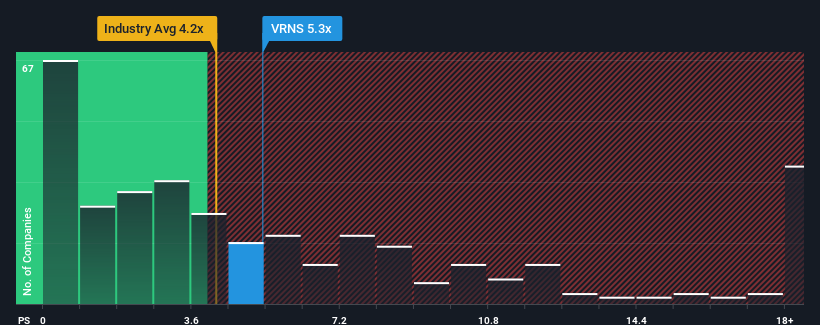
You may think that with a price-to-sales (or "P/S") ratio of 5.3x Varonis Systems, Inc. (NASDAQ:VRNS) is a stock to potentially avoid, seeing as almost half of all the Software companies in the United States have P/S ratios under 4.2x and even P/S lower than 1.9x aren't out of the ordinary. However, the P/S might be high for a reason and it requires further investigation to determine if it's justified.
Check out our latest analysis for Varonis Systems
What Does Varonis Systems' P/S Mean For Shareholders?
Varonis Systems certainly has been doing a good job lately as it's been growing revenue more than most other companies. It seems the market expects this form will continue into the future, hence the elevated P/S ratio. You'd really hope so, otherwise you're paying a pretty hefty price for no particular reason.
Keen to find out how analysts think Varonis Systems' future stacks up against the industry? In that case, our free report is a great place to start.
Do Revenue Forecasts Match The High P/S Ratio?
There's an inherent assumption that a company should outperform the industry for P/S ratios like Varonis Systems' to be considered reasonable.
Taking a look back first, we see that the company grew revenue by an impressive 18% last year. Pleasingly, revenue has also lifted 92% in aggregate from three years ago, thanks to the last 12 months of growth. So we can start by confirming that the company has done a great job of growing revenue over that time.
Turning to the outlook, the next three years should generate growth of 12% per annum as estimated by the analysts watching the company. Meanwhile, the rest of the industry is forecast to expand by 13% per year, which is not materially different.
With this information, we find it interesting that Varonis Systems is trading at a high P/S compared to the industry. It seems most investors are ignoring the fairly average growth expectations and are willing to pay up for exposure to the stock. These shareholders may be setting themselves up for disappointment if the P/S falls to levels more in line with the growth outlook.
The Final Word
Generally, our preference is to limit the use of the price-to-sales ratio to establishing what the market thinks about the overall health of a company.
Analysts are forecasting Varonis Systems' revenues to only grow on par with the rest of the industry, which has lead to the high P/S ratio being unexpected. When we see revenue growth that just matches the industry, we don't expect elevates P/S figures to remain inflated for the long-term. A positive change is needed in order to justify the current price-to-sales ratio.
It's always necessary to consider the ever-present spectre of investment risk. We've identified 1 warning sign with Varonis Systems, and understanding should be part of your investment process.
If companies with solid past earnings growth is up your alley, you may wish to see this free collection of other companies with strong earnings growth and low P/E ratios.
Have feedback on this article? Concerned about the content? Get in touch with us directly. Alternatively, email editorial-team (at) simplywallst.com.
This article by Simply Wall St is general in nature. We provide commentary based on historical data and analyst forecasts only using an unbiased methodology and our articles are not intended to be financial advice. It does not constitute a recommendation to buy or sell any stock, and does not take account of your objectives, or your financial situation. We aim to bring you long-term focused analysis driven by fundamental data. Note that our analysis may not factor in the latest price-sensitive company announcements or qualitative material. Simply Wall St has no position in any stocks mentioned.
Join A Paid User Research Session
You’ll receive a US$30 Amazon Gift card for 1 hour of your time while helping us build better investing tools for the individual investors like yourself. Sign up here
