
 Yahoo Finance
 There's Been No Shortage Of Growth Recently For Bonterra Energy's (TSE:BNE) Returns On Capital
Did you know there are some financial metrics that can provide clues of a potential multi-bagger? One common approach is to try and find a company with returns on capital employed (ROCE) that are increasing, in conjunction with a growing amount of capital employed. If you see this, it typically means it's a company with a great business model and plenty of profitable reinvestment opportunities. Speaking of which, we noticed some great changes in Bonterra Energy's (TSE:BNE) returns on capital, so let's have a look.
Understanding Return On Capital Employed (ROCE)
If you haven't worked with ROCE before, it measures the 'return' (pre-tax profit) a company generates from capital employed in its business. To calculate this metric for Bonterra Energy, this is the formula:
Return on Capital Employed = Earnings Before Interest and Tax (EBIT) ÷ (Total Assets - Current Liabilities)
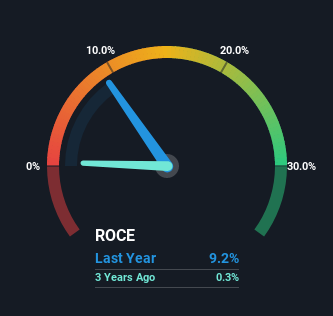
0.092 = CA$76m ÷ (CA$948m - CA$124m) (Based on the trailing twelve months to September 2022).
Thus, Bonterra Energy has an ROCE of 9.2%. Ultimately, that's a low return and it under-performs the Oil and Gas industry average of 21%.
See our latest analysis for Bonterra Energy
In the above chart we have measured Bonterra Energy's prior ROCE against its prior performance, but the future is arguably more important. If you'd like, you can check out the forecasts from the analysts covering Bonterra Energy here for free.
How Are Returns Trending?
We're pretty happy with how the ROCE has been trending at Bonterra Energy. The data shows that returns on capital have increased by 450% over the trailing five years. The company is now earning CA$0.09 per dollar of capital employed. Speaking of capital employed, the company is actually utilizing 25% less than it was five years ago, which can be indicative of a business that's improving its efficiency. Bonterra Energy may be selling some assets so it's worth investigating if the business has plans for future investments to increase returns further still.
The Bottom Line
In the end, Bonterra Energy has proven it's capital allocation skills are good with those higher returns from less amount of capital. Astute investors may have an opportunity here because the stock has declined 42% in the last five years. That being the case, research into the company's current valuation metrics and future prospects seems fitting.
Bonterra Energy does have some risks though, and we've spotted 3 warning signs for Bonterra Energy that you might be interested in.
While Bonterra Energy may not currently earn the highest returns, we've compiled a list of companies that currently earn more than 25% return on equity. Check out this free list here.
Have feedback on this article? Concerned about the content? Get in touch with us directly. Alternatively, email editorial-team (at) simplywallst.com.
This article by Simply Wall St is general in nature. We provide commentary based on historical data and analyst forecasts only using an unbiased methodology and our articles are not intended to be financial advice. It does not constitute a recommendation to buy or sell any stock, and does not take account of your objectives, or your financial situation. We aim to bring you long-term focused analysis driven by fundamental data. Note that our analysis may not factor in the latest price-sensitive company announcements or qualitative material. Simply Wall St has no position in any stocks mentioned.
Join A Paid User Research Session
You’ll receive a US$30 Amazon Gift card for 1 hour of your time while helping us build better investing tools for the individual investors like yourself. Sign up here
